Hi,
How do I have a white background like the below figures: 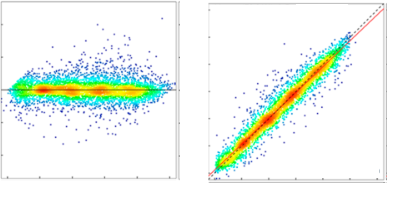
OBS = {0.32`, 0.38`, 0.44`, 0.5`, 0.56`, 0.62`, 0.68`, 0.74`, 0.8`,
   0.86`, 0.92`, 0.98`, 1.04`, 1.1`, 1.16`, 1.22`, 1.28`, 1.34`, 1.4`,
    1.46`, 1.52`, 1.58`, 1.64`, 1.7`, 1.76`, 1.82`, 1.88`, 1.94`, 2.`,
    2.3`, 2.6`, 2.9`, 3.2`, 3.5`, 3.8`, 4.1`, 4.5`, 4.8`, 5.1`, 5.4`,
   5.7`, 6.`, 6.3`, 6.6`, 6.9`, 7.2`, 7.5`, 7.8`, 8.1`, 8.4`, 8.7`,
   9.`, 9.3`, 9.6`, 9.9`};

DL = {0.483434196`, 0.542136072`, 0.611382606`, 0.664992403`,
   0.717187037`, 0.785657138`, 0.817604024`, 0.885892689`,
   0.931595386`, 1.003924369`, 1.080474604`, 1.582081792`,
   1.479712701`, 1.205274226`, 1.227835857`, 1.21714276`,
   1.354210476`, 1.29943604`, 1.41451306`, 1.504191906`, 1.554809371`,
    1.546290679`, 1.688226935`, 1.734784029`, 1.797105286`,
   1.818454316`, 1.819943037`, 1.948748007`, 2.210486301`,
   2.219253757`, 2.633416779`, 3.377471292`, 3.177418498`,
   3.419391237`, 3.667034246`, 5.109073793`, 5.757665578`,
   3.838614605`, 5.040199976`, 4.043855305`, 6.759191326`,
   7.710793921`, 5.528524842`, 6.68354987`, 6.052318273`, 6.33655636`,
    6.5210536`, 8.551142833`, 7.156680471`, 8.029122314`,
   9.193555892`, 8.358085894`, 10.13449034`, 8.282363095`,
   9.88117456`};

diff = MapIndexed[{First[#2], #1} &, DL - OBS];
pairs = Transpose[{DL, OBS}]
residual =
  SmoothDensityHistogram[diff, ColorFunction -> "BlueGreenYellow",
   PlotRange -> {{0, 60}, {-2, 2}}, Epilog -> Point[diff],
   ImageSize -> 400, PlotLegends -> Placed[Automatic, Below],
   FrameLabel -> {None, Style["Residuals", 14, Bold, Black]}];
scatter =
  SmoothDensityHistogram[pairs, ColorFunction -> "Rainbow",
   PlotRange -> {{0, 12}, {0, 12}},
   Epilog -> {Point[pairs], Line[{{0, 0}, {25, 25}}]},
   ImageSize -> 400];
Row[{residual, scatter}];
Thank you very much for your help :)


