Common problem, collective solution 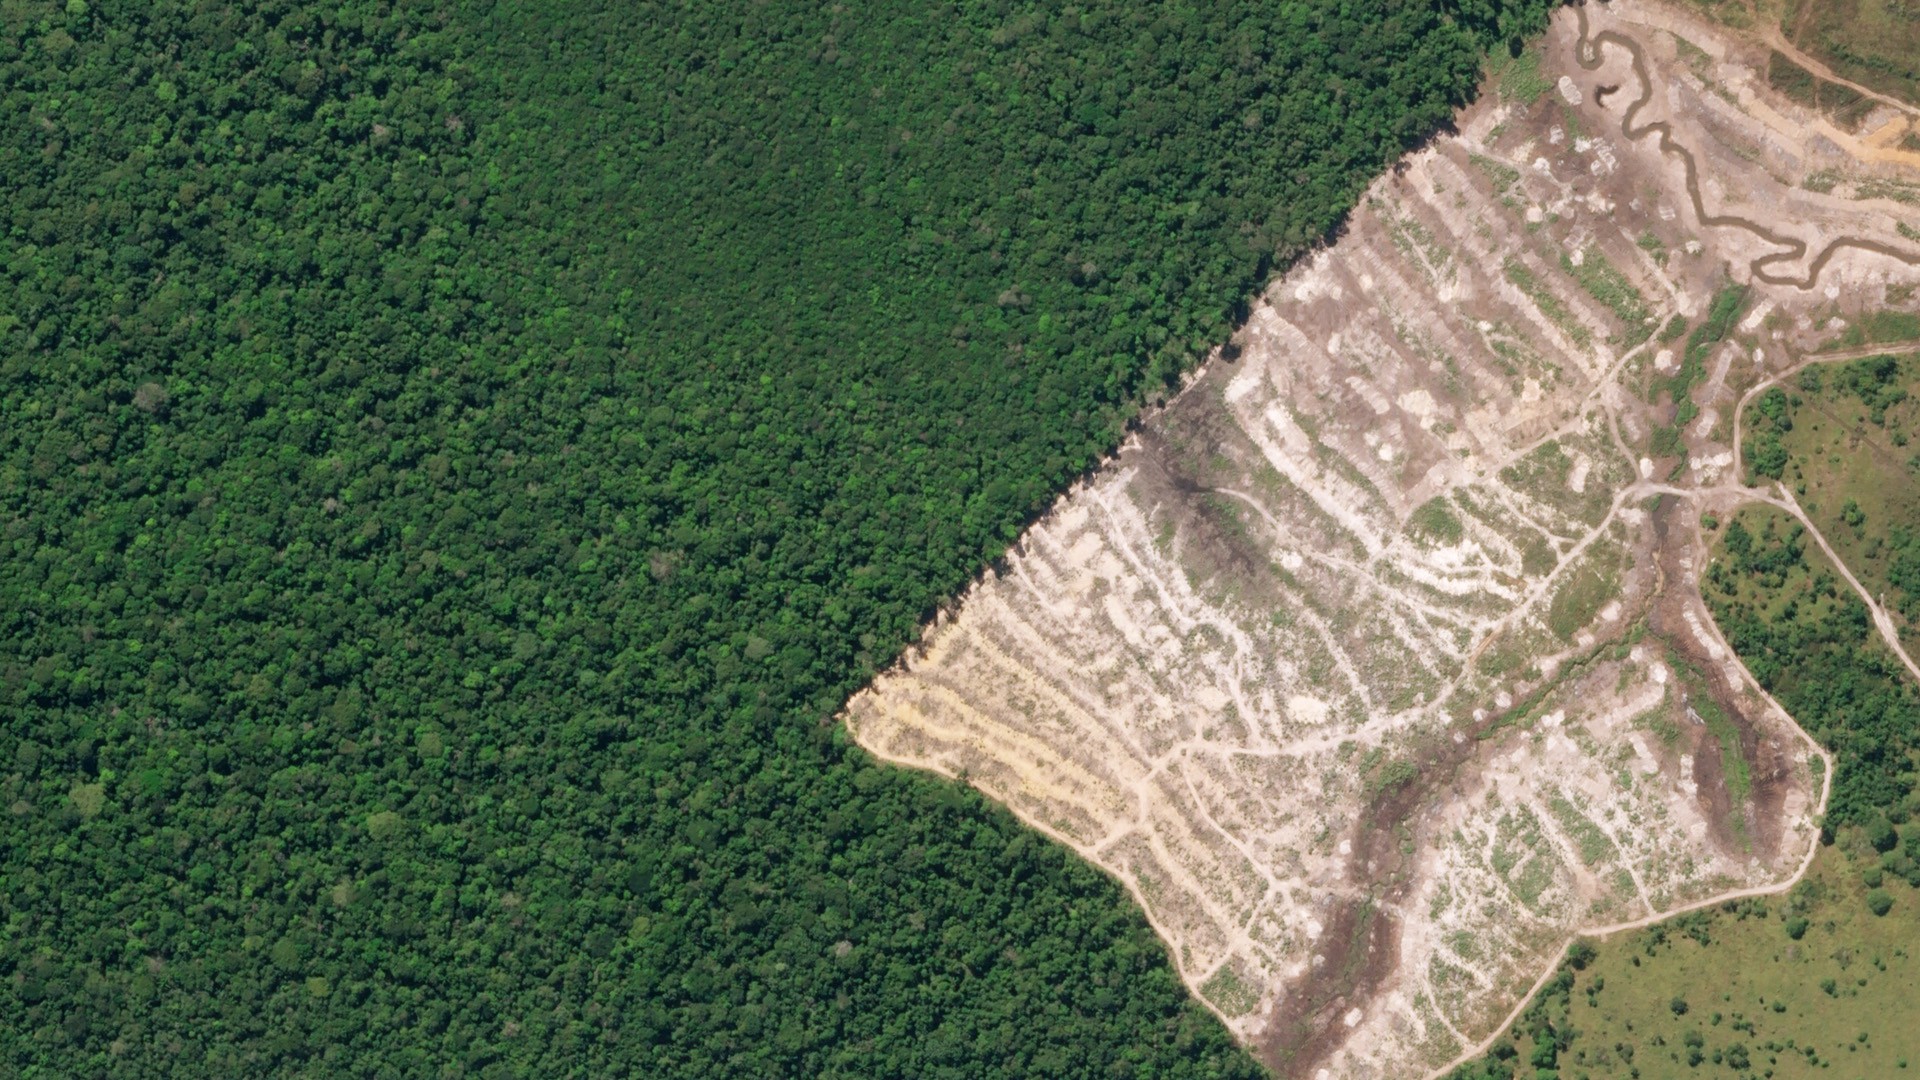 Source: Planet.com
The necessary planetary stewardship should start around the conservation and restoration of the rainforest. The information from satellite imagery is already freely available and its quality or accuracy will continue to improve; access to new techniques like machine learning or neural networks, and the mainstream adoption of mobile devices in society is allowing better analysis and more effective intervention. In that context, this project focuses on the automation of forest loss detection for any property in the Amazon and its registry into a blockchain, which then will provide that information in real-time to the participants of the network via periodic verifications. In order to get access to the network, a specific contract has to be previously defined. If the requirements of the contract are met, then the owner of the property will receive the agreed payment but if increasing deforestation is detected, there won't be any payment.
IDEA: Computational Resilience
Often times, conservation or sustainability efforts and their discussions are abstract or too focused on nice pictures. Of course, nature is beautiful, but we should incorporate a quantitative approach that could support more effective and systematic execution. Given the tools available now in the XXI century, we could use modern technology to understand and solve critical problems, like the ones happening in the rainforest and cities. In the context of current challenges like climate change and urbanization, the practice of sustainability in a computational way represents a necessary paradigm shift that can be adopted by a wide arrange of professionals. More importantly, if through innovation and entrepreneurship we engage individual users directly, giving them back something valuable, scale and impact could be reached surprisingly fast.
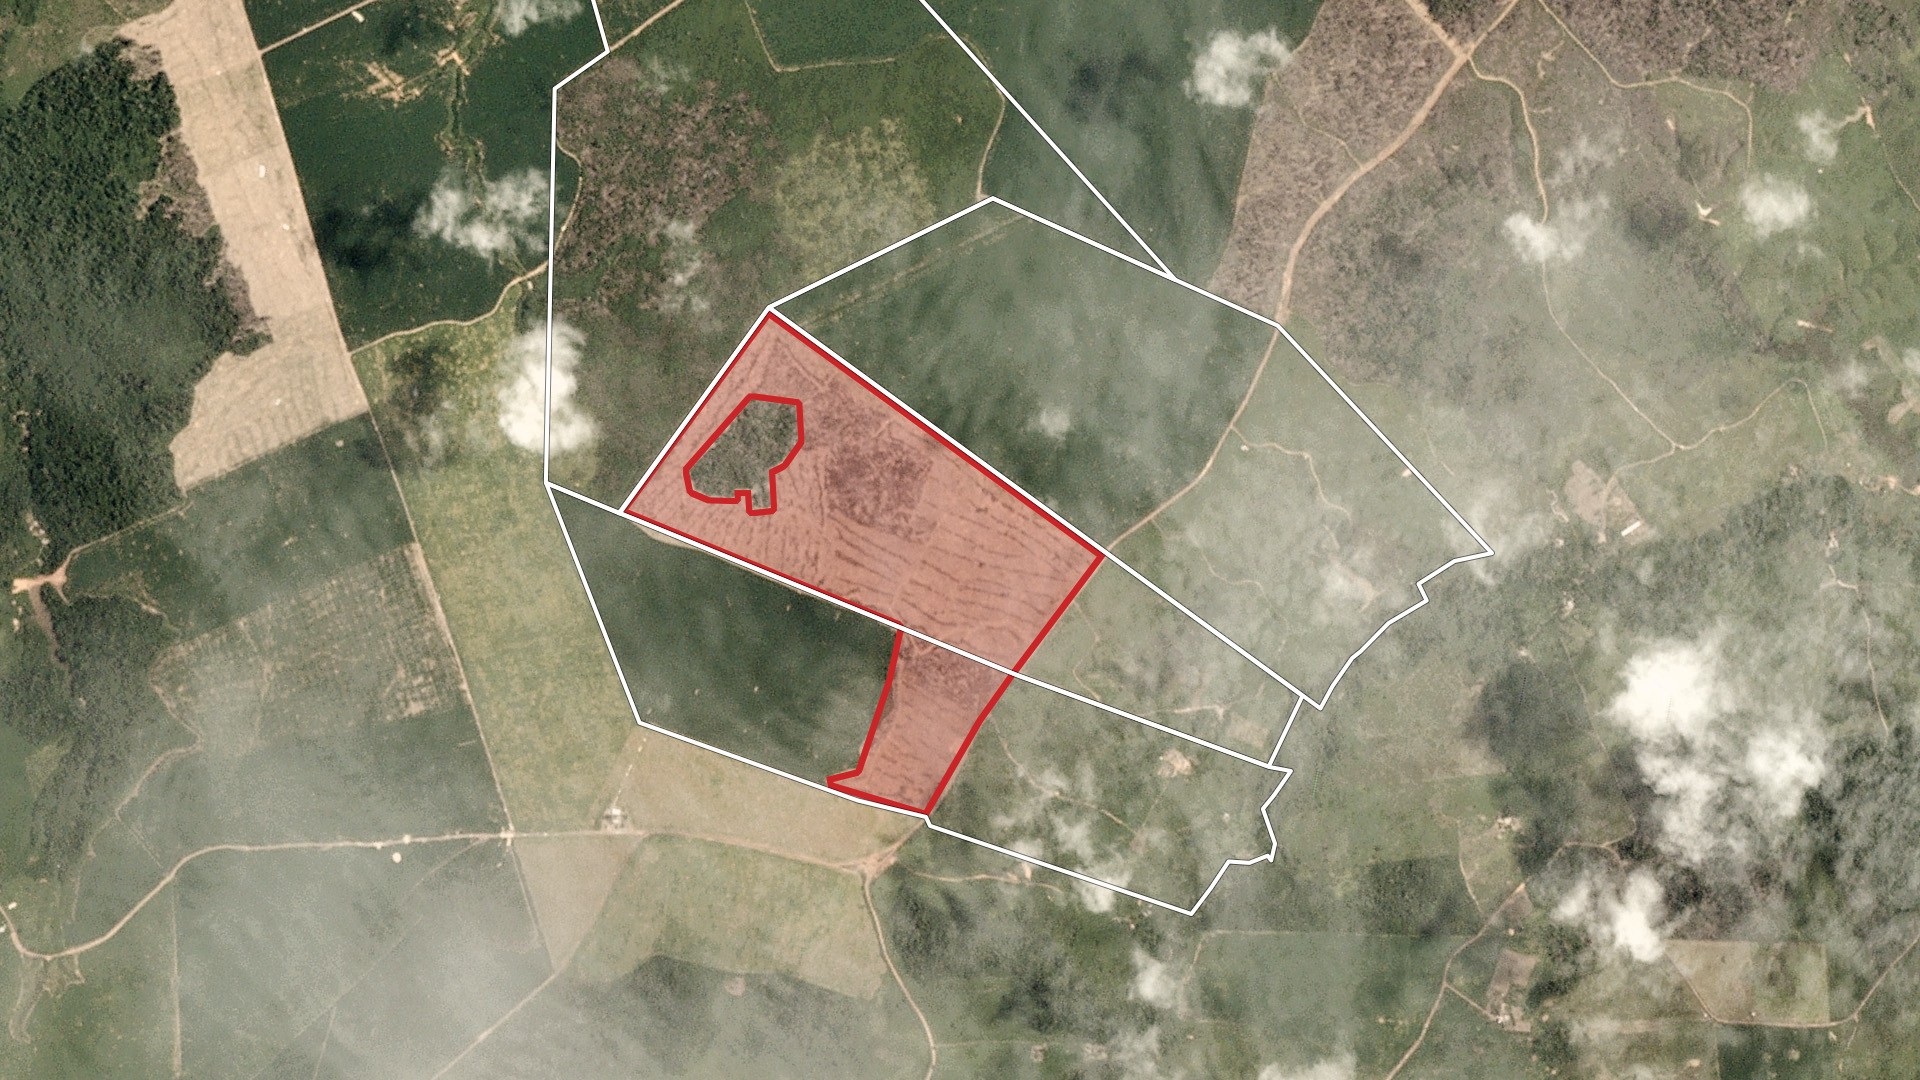 Source: Planet.com
1. Registry
There are two main ways to generate information related to potential participants. Depending on the data and know-how available, we should decide for one or the other but ideally, the more automated option should be implemented (Convolutional Neural Networks and permissionless Blockchain). Of course, Google's and Planet's services are one option but not the only one.
2. Contracts
Based on the information generated in the previous step, the property owners will have or not have access to the network (blockchain baked). On the other hand, there also will be contracts working as triggers of the incentives/payments for those who deliver a good performance in terms of reducing or avoiding deforestation.
3. Payments
Depending on the frequency on which the forest data is updated (daily, monthly, or annually), the system will verify the information of all the properties and compare that with its historical data in order to generate an unique order/key through the blockchain, allowing the agreed payment and its traceability, and solving the double accounting issue and the current lack of transparency due to it's spatial explicitly nature.
PROJECT: From forest loss detection to payments for performance using blockchain
DEFINITIONS: image processing and curation of data.
Global forest change data is available online at:
http://earthenginepartners.appspot.com/science-2013-global-forest/download_v1.6.html
The following data files describe forest cover in the year 2000, and forest cover loss between the years 2000 and 2018, in the region from -10 to -20 latitude, and from -70 to -80 longitudes:
https://storage.googleapis.com/earthenginepartners-hansen/GFC-2018-v1 .6/HansenGFC-2018-v1 .6treecover2000 _ 10S_ 080W.tif
https://storage.googleapis.com/earthenginepartners-hansen/GFC-2018-v1 .6/HansenGFC-2018-v1 .6lossyear _ 10S_ 080W.tif
These files have been downloaded to the following directory.
dir =~/Documents/WSS2019/WSS2019-FinalProject/
The files may be imported in the following manner.
    coverW80 =
      Import[dir <>
        "Data-Hansen/Hansen_GFC-2018-v1.6_treecover2000_10S_080W.tif"];

    lossW80 = Import[
       dir <> "Data-Hansen/Hansen_GFC-2018-v1.6_lossyear_10S_080W.tif"];
Each file is an image that is 40000 pixels by 40000 pixels.
    ImageDimensions[coverW80]
    ImageDimensions[lossW80]

    Out[4]= {40000, 40000}

    Out[5]= {40000, 40000}
Therefore, each pixel corresponds to 1/4000 degrees. The following commands convert between pixel coordinates and latitude/longitude.
    LongToPixel[x_] := Round[4000 (x + 80.0)]
    SetAttributes[LongToPixel, Listable]

    PixelToLong[x_] := x/4000.0 - 80
    SetAttributes[PixelToLong, Listable]

    LatToPixel[y_] := Round[-4000 (y + 10.0)]
    SetAttributes[LatToPixel, Listable]

    PixelToLat[y_] := -10 - y/4000.0
    SetAttributes[PixelToLong, Listable]
Use ImportPolygons[filename] to import the polygons in a shape file. The output is a list. The nth member of the list is the set of vertices of the nth polygon. Each vertex is given using pixel coordinates.
    ImportPolygons[file_] :=
     Map[GeoPosition[GeoGridPosition[#, "UTMZone19South"]] &,
       Cases[Import[file], Polygon[list_, ___] -> list, Infinity], {2}] /.
      GeoPosition[list_, ___] :> {LongToPixel[list[[2]]], LatToPixel[list[[1]]]}
The command ForestLoss[{lat1, long1}, {lat2, long2}, yrs] provides an image of the forest loss, measured in the years yrs, for the region from {lat1, long1} to {lat2, long2}. Each latitude is expected to be between -10.00025 and -19.97525, inclusive. Each longitude is expected to be between -79.99975 and -70.02475, inclusive. And yrs is expected to be a set of years from 2001 to 2018, inclusive.
    ForestLoss[{lat1_, long1_}, {lat2_, long2_}, yrs_, opts___] :=
     ArrayPlot[ImageData[
       ImageTake[lossW80, LatToPixel[{lat1, lat2}], LongToPixel[{long1, long2}]],
       "Byte"], ColorFunction -> (If[MemberQ[yrs, 2000 + #], Red,
          RGBColor[0, 0, 0, 0]] &), ColorFunctionScaling -> False, Frame -> False,
       opts]
The command SatImage[{lat1, long1}, {lat2, long2}] provides a satellite image for the region from {lat1, long1} to {lat2, long2}. Each latitude is expected to be between -10.00025 and -19.97525, inclusive. Each longitude is expected to be between -79.99975 and -70.02475, inclusive.
    SatImage[{lat1_, long1_}, {lat2_, long2_}, opts___] :=
     GeoImage[{GeoPosition[{lat1, long1}], GeoPosition[{lat2, long2}]},
      GeoRangePadding -> None, GeoProjection -> "Mercator", opts]
The command PropertyImage[poly, yrs, per] provides an image of the property represented by the polygons poly (as output by ImportPolygons), superimposed on a satellite image, and on an image of the forest loss, measured in the years yrs. The image has a padding of per percent around the property. The latitude of each point in the displayed region is expected to be between -10.00025 and -19.97525, inclusive. The longitude of each point in the displayed region is expected to be between -79.99975 and -70.02475, inclusive. And yrs is expected to be a set of years from 2001 to 2018, inclusive.
    PropertyImage[poly_, yrs_, per_, opts___] :=

     Module[{a, b, c, d, maxlat, maxlong, minlat, minlong, lat, long, loss,
       property, sat},
      {long, lat} = Transpose[Flatten[poly, 1]];
      maxlong = Max[long];
      minlong = Min[long];
      maxlat = Max[lat];
      minlat = Min[lat];
      {a, b} = {minlong, maxlong} + per/100.0 (maxlong - minlong) {-1, 1};
      {c, d} = {minlat, maxlat} + per/100.0 (maxlat - minlat) {-1, 1};
      sat = SatImage[{PixelToLat[c], PixelToLong[a]}, {PixelToLat[d],
         PixelToLong[b]}, opts];
      property =
       Graphics[{RGBColor[1, 1, 1, .3],
         Polygon /@ Map[{0, 40000} + {1, -1} # &, poly, {2}]},
        PlotRange -> {{a, b}, 40000 - {d, c}}, opts];
      loss = ForestLoss[{PixelToLat[c], PixelToLong[a]}, {PixelToLat[d],
         PixelToLong[b]}, yrs, opts];
      ImageCompose[ImageCompose[sat, property], loss]
      ]
The command LossCount[poly, yrs] counts the number of pixels of forest loss within the property represented by the polygons poly (as output by ImportPolygons), during the years yrs. Note that yrs is expected to be a set of years from 2001 to 2018, inclusive.
    LossCount[poly_, yrs_] :=

     Module[{maxlat, maxlong, minlat, minlong, lat, long, r},
      {long, lat} = Transpose[Flatten[poly, 1]];
      maxlong = Max[long];
      minlong = Min[long];
      maxlat = Max[lat];
      minlat = Min[lat];
      r = DiscretizeRegion[RegionUnion @@ (Region[Polygon[#]] & /@ poly)];
      Count[Cases[
        Flatten[MapIndexed[{#1, Reverse[#2] + {minlong, minlat} - {1, 1}} &,
          ImageData[ImageTake[lossW80, {minlat, maxlat}, {minlong, maxlong}],
           "Byte"], {2}], 1], {y_ /; MemberQ[yrs, y + 2000], p_} -> p],
       p_ /; RegionMember[r, p]]
      ]
EXAMPLE: a real case in the Southern Peruvian amazon; for the sake of the exercise we are not differentiating or calibrating the natural and human-made deforestation.
Registry
First, we define the area of interest by calling a satellite image.
        satexample =
         SatImage[{-12.6895, -73.8055}, {-12.6895 - 1/40, -73.8055 + 1/40}]
Second, we check the amount of forest loss for a specific year or a period of time.
        lossexample =
         ForestLoss[{-12.6895, -73.8055}, {-12.6895 - 1/40, -73.8055 +
            1/40}, {2018}]
Third, for a rapid visual contrast, we could simply overlap the two previous results.
ImageCompose[satexample, lossexample]
Consider the following property:
Import[dir <> "CN SHIPETIARI/Shipetiari.shp"]
First, we import the polygons using ImportPolygons. Note that the ImageSize option can be used to specify the size of the image.
    poly = ImportPolygons[dir <> "CN  SHIPETIARI/Shipetiari.shp"];
    PropertyImage[poly, Range[2001, 2018], 20, ImageSize -> 600]
Then we can immediately calculate the number of pixels per year and from there the area of forest loss.
    In[32]:= LossCount[poly, Range[2001, 2018]]

    Out[32]= 1508

    In[33]:= LossCount[poly, {2015}]

    Out[33]= 25

    In[34]:= LossCount[poly, {2018}]

    Out[34]= 124

    In[35]:= data = Table[LossCount[poly, {y}], {y, 2001, 2018}]

    Out[35]= {131, 70, 73, 73, 37, 16, 97, 70, 34, 230, 41, 79, 69, 92, 25, 67, 180, 124}

    BarChart[data, ChartLabels -> Range[1, 18]]
    In[35]:= Export[dir <> "testfile.csv", {data, Range[2001, 2018]}]

    Out[35]= "~/Documents/WSS2019/WSS2019-FinalProject/testfile.csv"
Contract
Coding the contract: Assume that the contract began in 2010, and is evaluated once a year. Ideally, the string URL should be a URL to the property's online polygon data in the official Peruvian registry. For this demonstration, a locally-stored file is used, instead. Then, an example of a possible contract would be the following.
Block[{begin=2010,poly,url=dir<>"CN  SHIPETIARI/Shipetiari.shp"},
poly=ImportPolygons[url];If[LossCount[poly,Range[2001,2010]]/(2010-2001+1)>LossCount[poly,{First[DateList[]]-1}],BlockchainPut["Pay"],BlockchainPut["Don't pay"]]]
Writing the contract: For this example, we are considering the average deforestation from the previous ten years to the beginning of the contract. The forest loss detected should be lower than that number in order to comply with the contract and get the payment.
In[22]:= contractTXId =
 BlockchainPut[
  Hold[Block[{begin = 2010, poly,
     url = dir <> "CN  SHIPETIARI/Shipetiari.shp"},
    poly = ImportPolygons[url];
    If[LossCount[poly, Range[2001, 2010]]/(2010 - 2001 + 1) >
      LossCount[poly, {First[DateList[]] - 1}], BlockchainPut["Pay"],
     BlockchainPut["Don't pay"]]]]]

Out[22]= "a3a3475e55915b894c17175ebea63efcc9561b14eded9ab7710d6cc07d988064"
Note that the average loss between 2001 and 2010 was around 83 pixels.
    In[27]:= N[LossCount[poly, Range[2001, 2010]]/(2010 - 2001 + 1)]

    Out[27]= 83.1
The loss last year (2018), was 124 pixels.
    In[30]:= LossCount[poly, {First[DateList[]] - 1}]

    Out[30]= 124
Executing the contract: Once a year, we evaluate the contract:
In[23]:= resultTXId = ReleaseHold[BlockchainGet[contractTXId]]

Out[23]= "e1fce4b7236463f3895473e5608dc9273296b4bd44c9daf85a6b2fe1985878db"
Payment: the process generates knowledge to make a decision.
    In[24]:= BlockchainGet[resultTXId]

    Out[24]= "Don't pay"
PRODUCT: Funding Platform
Funding platform for climate change or sustainability projects, by connecting planetary stewards and securing transactions between them.
There will be two types of participants, the ones who do the payments and the ones who get paid, similar to Kickstarter or Patreon. Each area or landscape will have its own fund following a specific set of rules for the redistribution of the money within its inhabitants (participants). The innovative idea has to do with a system of "points" for the engagement of individuals, as a complement of the economic transactions between organizations like companies and communities. Using the smartphones we can directly reach millions of individuals influencing their behavior towards a more sustainable lifestyle.
FUTURE WORK
Design, develop, and test a commercial prototype of a funding platform for planetary stewardship, if successful, a company will be created.
Incorporate machine learning, convolutional neural networks, and satellite imagery with better temporal and spatial resolution, then connect these results with a blockchain through a classifier.
Automate the detection not only of deforestation but also of land-use change (what happens afterward).
Development of a dynamic Forest Index, as a practical proxy for ecosystem's health.
Analyze the connections with UBI (Universal Basic Income) and poverty reduction in rural areas.
ACKNOWLEDGEMENT
Thanks to Stephen Wolfram, Matthew Szudzik, and Christian Pasquel for their suggestions and help with the code.


