Introduction
The process of star classification is a man-made process, which consists in the separation of a huge amount of data and also in the creation of catalogs. Machine learning has been used in the cosmos to predict, categorize and classify specific characteristics of stars, such as size and other features with the use of images of stars captured over time.
Scope of the project
In this project we determine the coordinates of a configuration of stars, that is, its right ascension and declination, through images of stars using the Wolfram language. The use of the Wolfram language was implemented for an image pattern recognition to mark the potential places that correspond specifically with the referenced contents. A triangular mesh for the subject image and the reference image are created, and they are compared to localize the specific pattern. Overall, the project consisted of receiving an image of a configuration of stars and returns the coordinates where that set of points is most probably located. As the simplest case of the implementation of the algorithm, having a combination of random points as a reference and recognizing the specific patterns of that points and return the coordinates of the configuration from where that set of points is probably located.
Methodology
Delaunay triangulation: A triangulation is a subdivision of an area into triangles. A triangulation is a subdivision of an area into triangles. Delaunay triangulations have two important properties. First property three points belonging to P are vertices of the same face of the Delaunay triangulation of P, if only, the circle that passes through the points does not contain points of P inside. Second property two points belonging to P form one side of the Delaunay triangulation of P, if and only if there is a circle that contains the two points on its circumference and does not contain any P.
Data
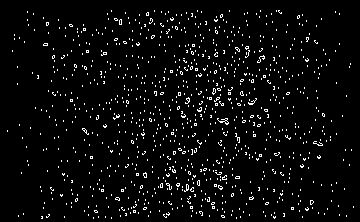
We input the image that we are going to work with.
ImageStar="imagesS.png"
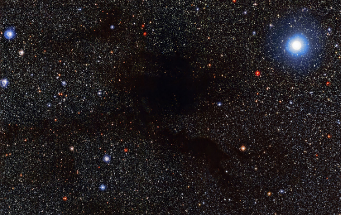
Then we create a scalar vector graphic from the image. And we can create a partition of the whole image into an array of 20×20 pixel sub-images. We compute the number of edges at the scale of the specified pixel range which in this case is 1. Now we can proceed to construct thetrinagular mesh on the desire image, and we create a list of the pixels position in the image that correspond to each of the edge created before. Here we can display the values of the pixels corresponding to the edges. Then finally we create a nested list of the image in the sense to improve the triangulation with the purpose that the program can recognize the specific pattern later on.
Substar = RandomChoice[Flatten[ImagePartition[ScalableV, 20]]]
edges = EdgeDetect[Substar, 1]
bounds = Transpose[{{0, 0}, ImageDimensions[Substar]}]
Delaunay = DelaunayMesh[ImageValuePositions[edges, White], bounds]
ListAnimate[
 TriMesh =
  NestList[DelaunayMesh[Mean @@@ MeshPrimitives[#, 2], bounds] &,
   Delaunay, 3]]
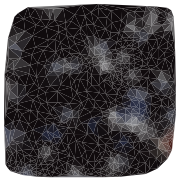
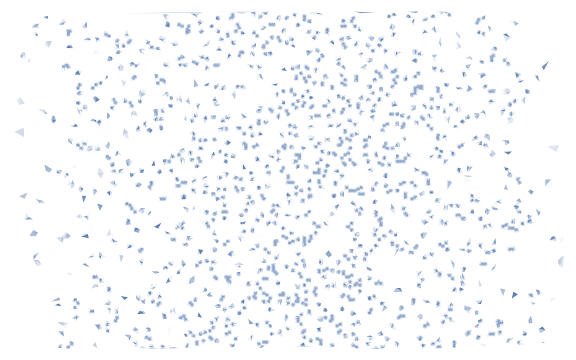
Here we can display the final image with triangulation and we obtain the the graphics primitives for the specified cell and it displays the image.
FinalImage =
 Rasterize[
  Graphics[Table[{RGBColor[ImageValue[Substar, Mean @@ l]], l}, {l,
     MeshPrimitives[Last[TriMesh], 2]}], ImageSize -> Small]]
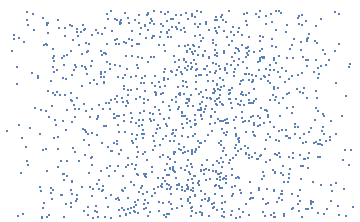
Now we plot the star map with fifteen thousand stars that are near the earth. Using the coordinates and the name with the stardata[] database in the Wolfram language.
StarMap =
 Rasterize[
  ListPlot[Tooltip[{QuantityMagnitude[#[[2]],
        "HoursOfRightAscension"],
       QuantityMagnitude[#[[1]], "AngularDegrees"]}, #[[3]]] & /@
    StarData[
     EntityClass[
      "Star", {EntityProperty["Star", "DistanceFromEarth"] ->
        TakeSmallest[1500]}], {"RightAscension", "Declination"}],
   Axes -> False]]
Here we do the same process as before but with the star map image. We locate its edges and construct the triangular mesh.
edgeS = EdgeDetect[StarMap, 1]
Then a nested list of the mesh is created with the use of primitive mesh for specified mesh cells.
DelaunayS = DelaunayMesh[ImageValuePositions[edgeS, White], boundS]
ListAnimate[
 TriMesh1 =
  NestList[DelaunayMesh[Mean @@@ MeshPrimitives[#, 2], boundS] &,
   DelaunayS, 3]]
Finally we create the image with the triangular mesh so we can proceed to compare the image of study and the reference image
FinalStarImage =
 Rasterize[
  Graphics[Table[{RGBColor[ImageValue[StarMap, Mean @@ l]], l}, {l,
     MeshPrimitives[Last[TriMesh1], 2]}], ImageSize -> Large]]
Then we compare the images and highlight the possible locations that correspond to the specific pattern if there is a match.
CorrelationMap =
 ImageAdjust[
  ImageCorrelate[FinalStarImage, FinalImage,
   NormalizedSquaredEuclideanDistance]]
HighlightImage[StarMap,
 Dilation[ColorNegate[Binarize[CorrelationMap, 0.1]], DiskMatrix[10]]]
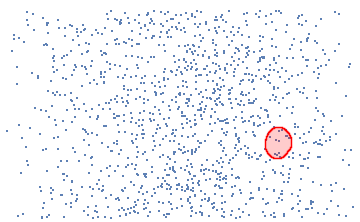
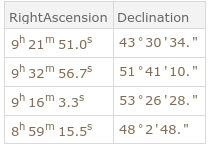
With the highlighted areas we can approximate the stars we are looking for in the star map and retrieve the information with the use of Stardata from Wolfram language.
Dataset[StarData[#, {"RightAscension", "Declination"},
    "PropertyAssociation"] & /@ {"GJ3554", "Gl354B", "Gl339.1",
   "Gl331C"}]
Future work
As future work, it is possible to add reference stars, bright guide stars and stars. Consider factors such as the brightness of the stars. The algorithm works, but for specific cases. In this study it was considered that the stars have the same brightness. If we want to extend the use of the program by adding the concept that there are more bright stars than others, the algorithm fails to find specific patterns since it is not capable of distinguishing the difference, whether one point is brighter than another point. Especially when the neighboring stars are very close, the selection of the configuration close to another neighborhood that seems to be similar, may be incorrect. As an alternative to solving the problem, it is possible to create an artificial neural network in which the training parameters would be images that would be associated to the coordinates of where the images were taken. Finally, the network would return as a result the most probable location for that configuration of stars.


