A visualisation of 500 iterations on a map of contiguous US states
Introduction
The goal of this project is to create a function, which generates cartograms. Cartograms are geometrically distorted maps, where the distortion conveys a piece of information obtained from the due dataset.
Currently, more than 25 different algorithms for creating distortion can be found in the literature. As I really enjoy working with matrices, I decided to use the Cellular Automata method1. This algorithm was developed in 1990 by Daniel Dorling, an English social geographer and a professor of Geography at the University of Oxford. The limitations of this approach are that it does not work properly for non-contiguous areas and that it preserves the global borders. However, it is relatively easy to implement in the Wolfram Language and the output is reliable.
Algorithm
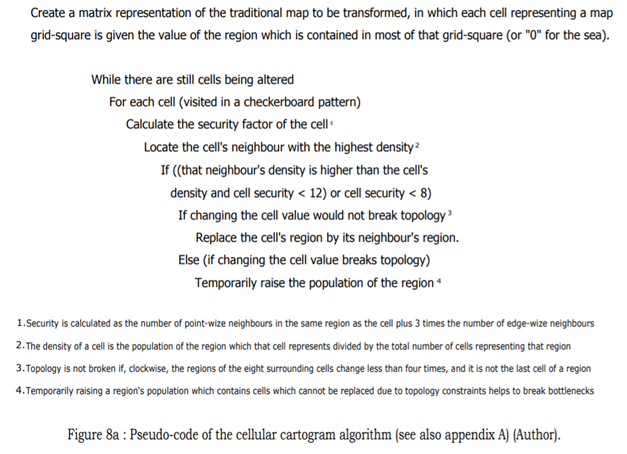
As checking the topology condition would be computationally too difficult, I decided to omit it. I will talk about the implications of this decision later.
Code
Cartogram[geoPolysi:{__Rule},numberOfIterations_:30,res_:100, plotAll_?BooleanQ]:=
    Module [
        {regions,masks,map,mapPairs,population,numberOfCells,cellDensity,gPairs,geoPolys},

        geoPolys = Keys[geoPolysi];

        regions = Range[Length[EntityValue[geoPolys,"Polygon"]]];

        map = (
            masks = Function [
                poly, ImageData [
                    Binarize @ Rasterize [
                        Style [
                            Graphics [
                                {White, MeshPrimitives[DiscretizeGraphics @ poly, 2]},
                                Background -> Black,
                                PlotRange -> Reverse @ GeoBounds [
                                    EntityValue[geoPolys,"Polygon"]
                                    ]
                                ],
                            Antialiasing -> False
                        ],
                        RasterSize -> res
                    ],
                    "Bit"
                ]
            ] /@ EntityValue[geoPolys, "Polygon"];

            Fold [
                #1 + Clip [
                        #2-(#2*#1),
                        {0,Infinity}
                    ]&,
                    MapIndexed [
                        #1 * First[#2]&,
                        masks
                    ]
            ]
        );

        mapPairs = BlockMap [
            {
                #[[2,2]],
                3*Count [
                    Position [
                        Flatten[#],
                        #[[2,2]]
                    ],
                    _?EvenQ,
                    2
                ] + Count [
                    Position [
                        Flatten[#],
                        #[[2,2]]
                    ],
                    _?OddQ,
                    2
                ] -1
            }&,
            ArrayPad[map, 1, 0],
            {3, 3},
            {1, 1}
        ];

        population = QuantityMagnitude[Values[geoPolysi]];

        numberOfCells = (Count[map, #, 2]) & /@ Range[Length[EntityList[geoPolys]]];

        cellDensity = N[Prepend[population / numberOfCells, 0]];

        gPairs = mapPairs /. {a_Integer, b_Integer} -> g[a, b];

        (
            f [{
                    {g[a1_, a2_], g[b1_, b2_], g[c1_, c2_]},
                    {g[d1_, d2_], g[e1_, e2_], g[f1_, f2_]},
                    {g[g1_, g2_], g[h1_, h2_], g[i1_, i2_]}
                }] :=

                Module [
                    {highest, nsecurity},
                    If [
                        numberOfCells[[e1]] > 1 && e1 =!= 0,

                        highest = First [
                            Sort [
                                {a1, b1, c1, d1, f1, g1, h1, i1},
                                cellDensity[[#1+1]] > cellDensity[[#2+1]]&
                            ]
                        ];
                        nsecurity = RandomChoice [
                            Cases [
                                {{a1, a2}, {b1, b2}, {c1, c2}, {f1, f2}, {i1, i2}, {h1, h2}, {g1, g2}, {d1, d2}},
                                {highest, s_} -> s,
                                {1},
                                1
                            ]
                        ];
                        If [
                            (cellDensity[[highest+1]] > cellDensity[[e1+1]] && e2 < 12) || e2 < 8,
                            g[highest, e2],
                            g[e1, e2]
                        ],

                        g[e1,e2]
                     ]
                ]
        );
        (
            regionStep[gPairs_] :=
                BlockMap [
                    f,
                    ArrayPad[gPairs, 1, g[0, 0]],
                    {3,3},
                    {1,1}
                ];

            recalcSecurities[gPairs_] :=
                BlockMap [
                    g [
                        #[[2,2]],
                        3*Count [
                            Position [
                                Flatten[#],
                                #[[2,2]]
                            ],
                            _?EvenQ,
                            2
                        ]
                        +
                        Count [
                            Position [
                                Flatten[#],
                                #[[2,2]]
                            ],
                            _?OddQ,
                            2
                        ] - 1
                    ]&,
                    ArrayPad[gPairs[[All, All, 1]], 1, "-"],
                    {3,3},
                    {1,1}
                ];

            recalcDensities[gPairs_] := Module [
                {numberOfCells},
                numberOfCells = (Count[gPairs[[All, All, 1]], #, 2])& /@ regions;
                cellDensity = N[Prepend[population / (numberOfCells + 1), 0]]
            ];
        );

        steps1 = NestList [
            (
                recalcDensities[#];
                recalcSecurities[regionStep[#]]
            )&,
            gPairs,
            numberOfIterations
        ];
        If[
           TrueQ[plotAll],
           ArrayPlot[#[[All, All, 1]]]& /@ steps1,
           ArrayPlot[Last[steps1][[All, All, 1]]]
           ]
    ];

Cartogram[geoPolysi:{__Rule},numberOfIterations_:30,res_:100]:=Cartogram[geoPolysi,numberOfIterations,res, False]

Cartogram[geoPolys_, opts___] :=
    Cartogram [
        Normal [
            DeleteMissing[
               EntityValue [
                   geoPolys,
                   "Population",
                   "EntityAssociation"
            ]
            ]
        ],
        opts
    ];
The function has got 4 arguments, 3 of which are optional and have default values. The first argument can takes an entity of the type Country. Initially, I was planning to use the Wolfram language built-in function CellularAutomata, but the function is not suitable due to delayed updating of values during iterations.
Output
Generating a plot of a region. When not given any specific values for countries, the function automatically calculates population densities and distorts the map based on that. 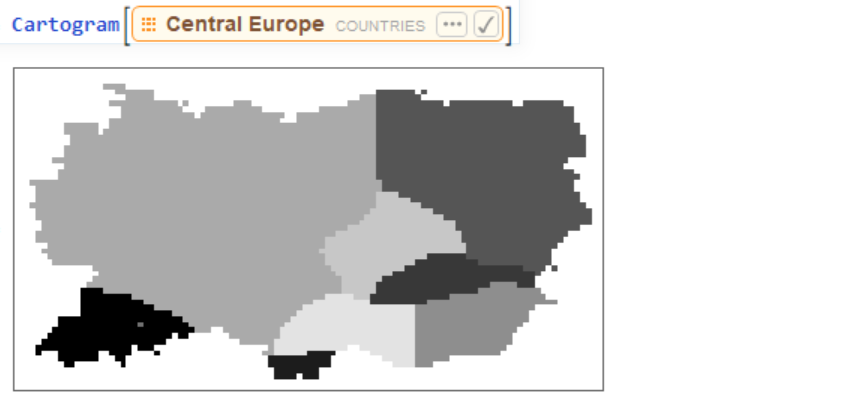 Running the function for a list of countries.
 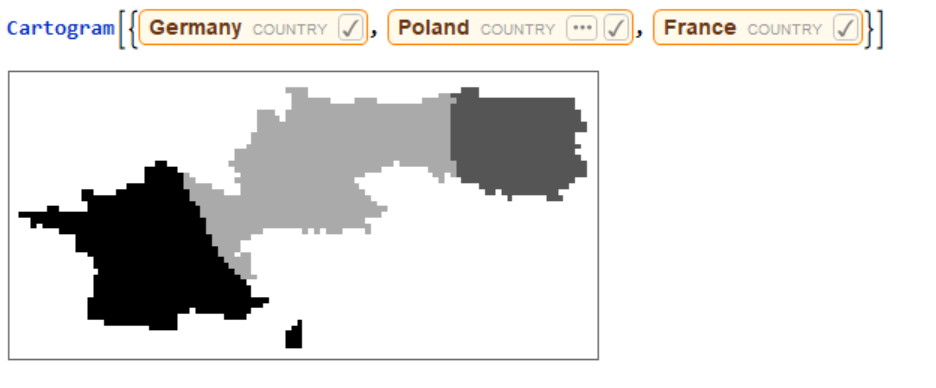 Running the function for a list of countries using the user-input values.
 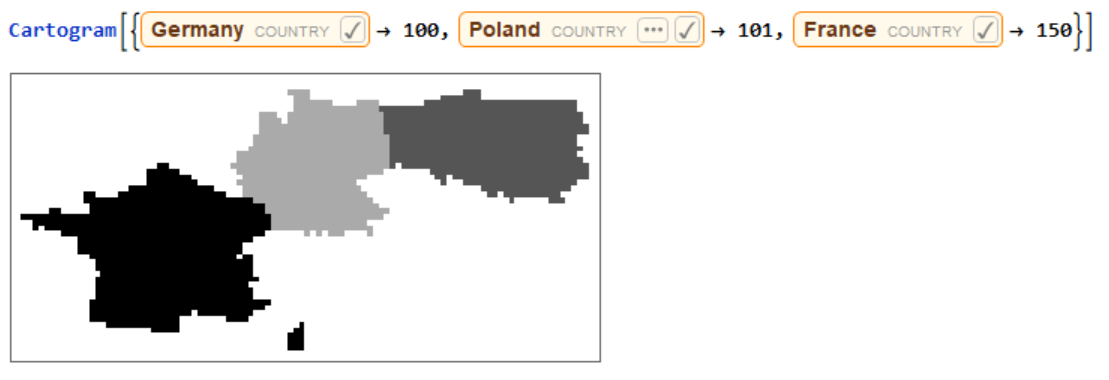 Running the function for just one iteration.
 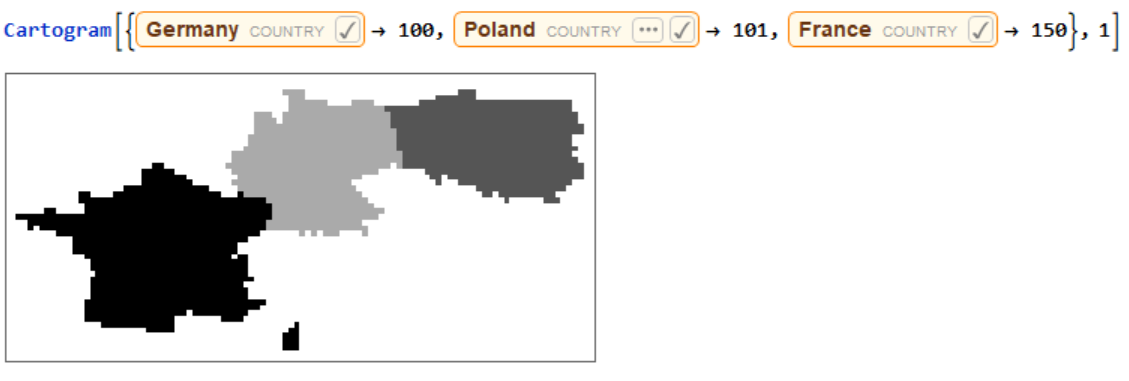 Running the function for 5 iterations with the width of 400 pixels.
 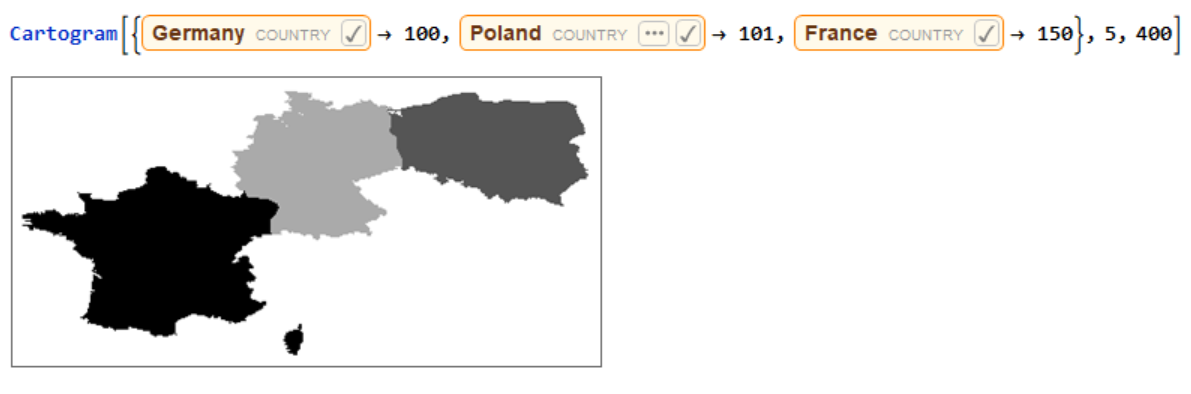 Returns all steps of first 5 iterations.
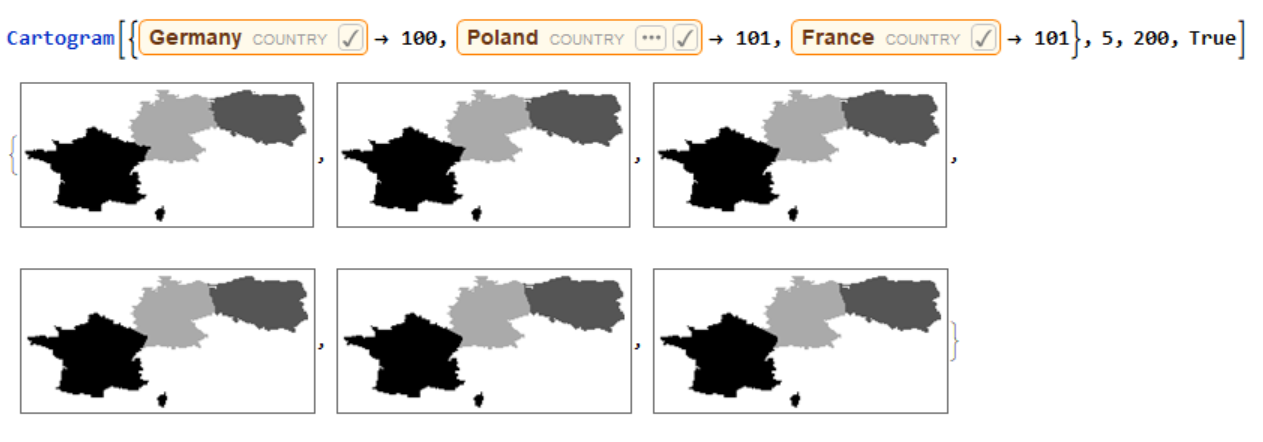
As promised in the Algorithm section, now I will explain the consequences of omitting the topology condition. When different regions (countries) reach equal densities, the areas adjacent to borders will keep oscillating. This is due to the fact that there are no restrictions on the number of times each cell in a neighbourhood can change its region, and thus bordering cells will do so during each iteration (as they have low security factors mentioned in the algorithm).
 Oscillations described above.
References
Dorling, D. (1996). Area cartograms. Norwich: Geo Abstracts Univ. of East Anglia, p.30.
Acknowledgments
Mentor: Christopher Wolfram


