Overview
Acute Lymphoblastic Leukemia (ALL), or Acute Lymphocytic Leukemia, is a cancer of the lymphoid line of blood cells characterized by the development of large numbers of immature lymphocytes. A microscopic examining of blood smear is necessary for the diagnosis of ALL; however, this step is labor-intensive and requires highly trained doctors. An automated system can overthrow these drawbacks of manual examination. Also, it will reduce the burden of medical professionals and will provide accurate and effective results when compared to manual analysis. By using image processing and machine learning, images of peripheral blood slides were analyzed. First, image processing was used to pick out the lymphoblasts and lymphocytes from these images. Specifically, functions that operate on color were used because these cells have a very dark purple color that stands out. Then, a classifier was trained and tested to distinguish these cells into lymphoblasts and lymphocytes.
Refining the Data for Training/Testing of Machine Learning
To refine the 260 images of individual lymphoblasts, the DominantColor function and ColorDetect function were used to detect the least green color in the images. The least green color is the most purple, which is the color of the lymphoblasts. I created the function that takes the refined image and chooses components that are not adjacent to the border of the image and is not smaller than a certain area threshold. Then, the coordinates of the component are expanded and they are used to trim those coordinates from the original image. 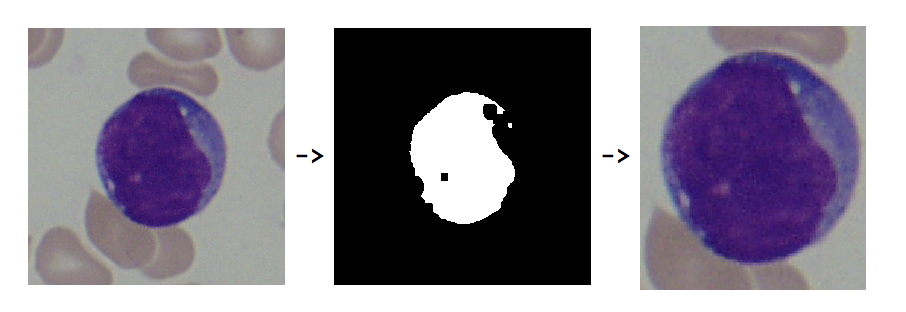
Machine Learning
This function takes a random seed, develops a classifier with 80% of the data used for train and returns the classifier measurements analysis from 20% of the data. The train data and test data are separated by using RandomSample. In order to normalize the accuracy, the function was used 100 times. 80% of the dataset was used to train the classifier and the other 20% was used to test it. The average accuracy of the 100 classifiers made is 98.1%. The standard deviation of the accuracy was 2.1%.
randomclassifier[seednum_] :=
 Module[{blaststest, blaststrain, notblaststrain, notblaststest,
   classifier, notblastcomplement, blastcomplement, cm, testdata,
   results},
  RandomSeed[seednum];
  blaststrain = RandomSample[blastcelltrain, Length[blast]*0.8];
  notblaststrain =
   RandomSample[notblastcelltrain, Length[notblast]*0.8];
  blastcomplement = Complement[blast, blaststrain];
  blaststest = Map[# -> "Blast Cell" &, blastcomplement];
  notblastcomplement = Complement[notblast, notblaststrain];
  notblaststest = Map[# -> "Not Blast Cells" &, notblastcomplement];
  classifier =
   Classify[<|"Blast Cell" -> blaststrain,
     "Not Blast Cells" -> notblaststrain|>];
  testdata = Flatten[{blaststest, notblaststest}];
  cm = ClassifierMeasurements[classifier, testdata];
  results = Grid[{#, cm[#]} & /@ cm["Properties"], Frame -> All];
  {results, classifier}]
Extracting Features from the Complete Pictures of Blood
The three functions provided below analyzes a peripheral blood smear image as a whole. The first function detects the least green color from the image, which would be a dark purple color of the lymphoblasts. Then, the second function uses ComponentMeasurements to components that are not adjacent to the edges of the image and has an area larger than 3000. The last function combines these two functions and provides the whole analysis on the image.
find[image_, dilationparameter_: 1, binarizeparameter_: 0.6,
  erosionparameter_: 3] :=
 Module[
  {dominantcolors, detectedcolors, refinedimage, dominantcolor},
  dominantcolors = DominantColors[image];
  dominantcolor = SortBy[dominantcolors, #[[2]] &][[1]];
  detectedcolors = ColorDetect[image, dominantcolor];
  refinedimage =
   Erosion[Dilation[
     Binarize[ImageAdjust[detectedcolors], binarizeparameter],
     dilationparameter], erosionparameter];
  {image, refinedimage, dominantcolor}
  ]
select[input_, coordinateparameter_: 30, areaparameter_: 3000] :=

 Module[
  {components, blasts, blastcoordinates, coordinates, originalimage,
   refinedimage},
  originalimage = input[[1]];
  refinedimage = input[[2]];
  components =
   ComponentMeasurements[
    refinedimage, {"Image", "AdjacentBorders", "Area",
     "PerimeterLength", "BoundingBoxArea",
     "BoundingBox"}, #Area >
       areaparameter && #AdjacentBorders == {} &];
  blastcoordinates = #[[2, -1]] & /@ components;
  coordinates =
   Map[{{#[[1, 1]] - coordinateparameter, #[[1, 2]] -
        coordinateparameter}, {#[[2, 1]] +
        coordinateparameter, #[[2, 2]] + coordinateparameter}} &,
    blastcoordinates];
  {ImageTrim[originalimage, #],
     Flatten[{Mean[#[[All, 1]]], Mean[#[[All, 2]]]}]} & /@
   coordinates
  ]
overall[image_] :=
 Module[
  {result1, result2, result3, classifiedresults},
  result1 = find[image];
  result2 = select[result1[[1 ;; 2]]];
  classifiedresults = classifiersample[#[[1]]] & /@ result2;
  result3 =
   Grid[Prepend[
     Partition[Flatten[Riffle[result2, classifiedresults], 1],
      3], {"Detected Lymphoblast", "Coordinates of the  Center",
      "Classified"}], Frame -> All];
  {image, result3}
  ]
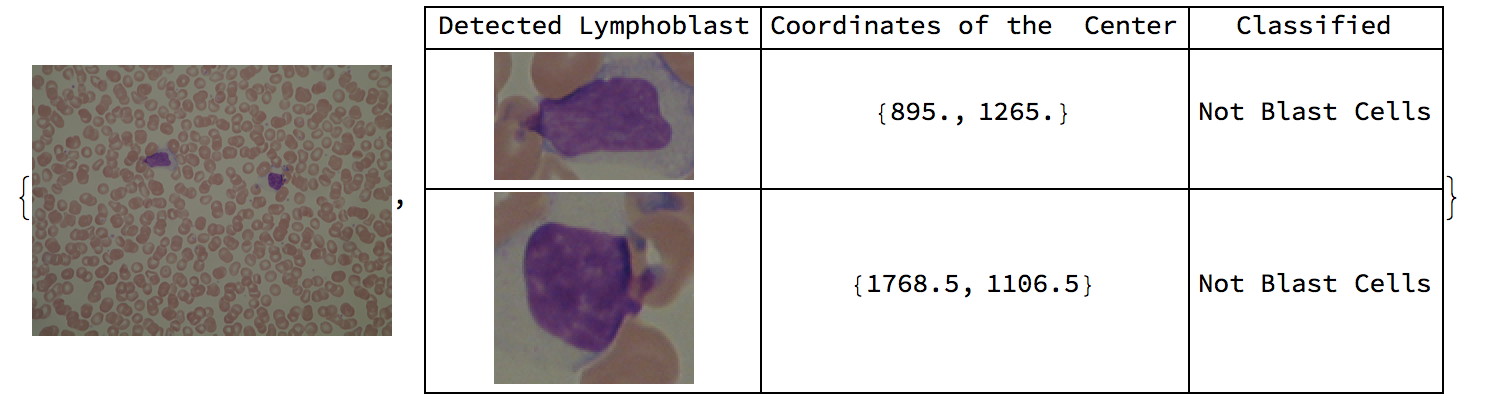
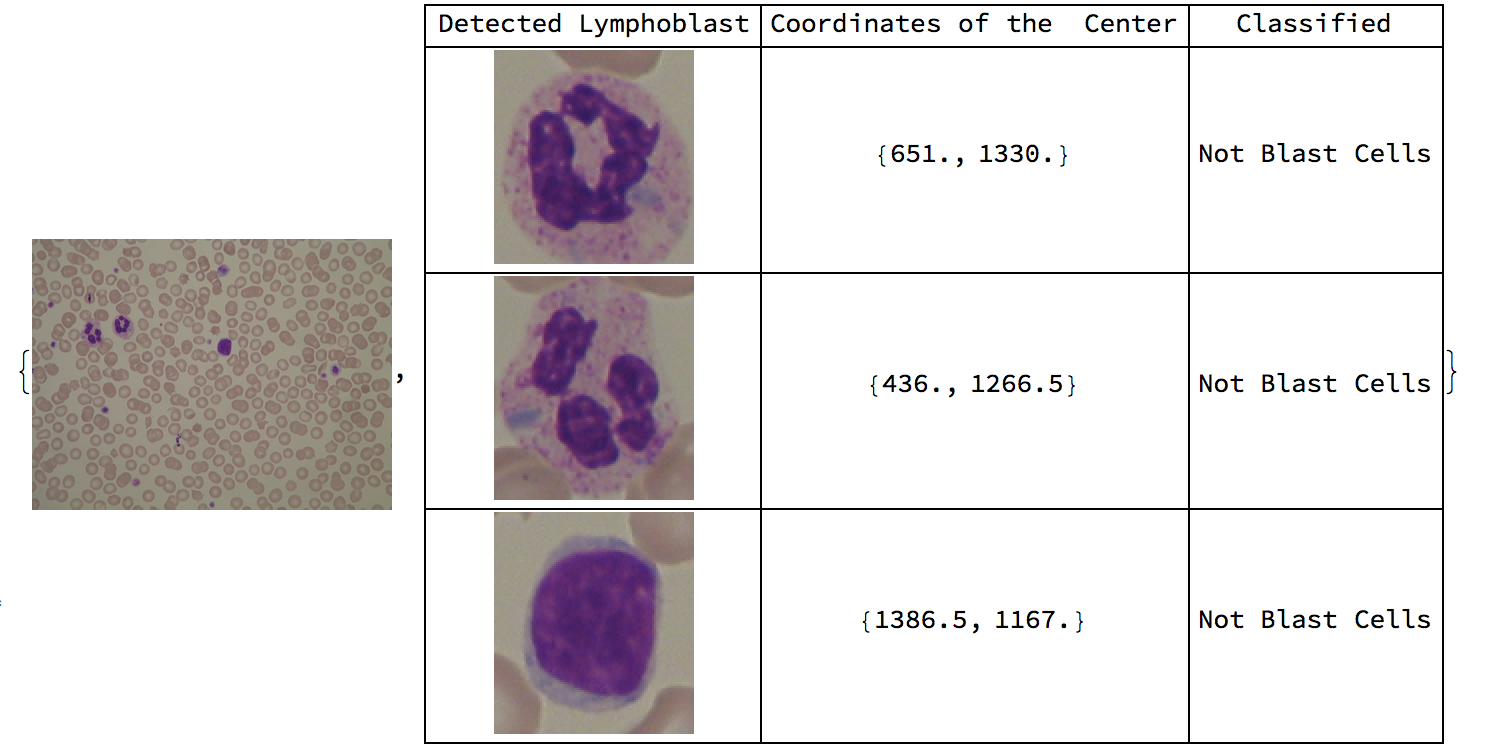
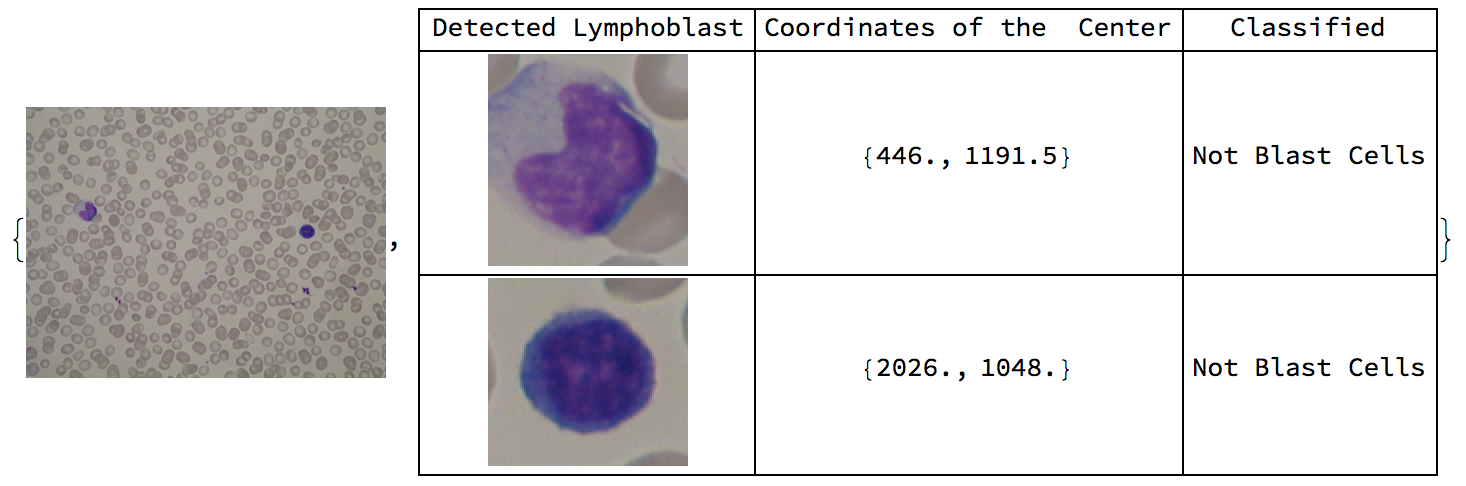
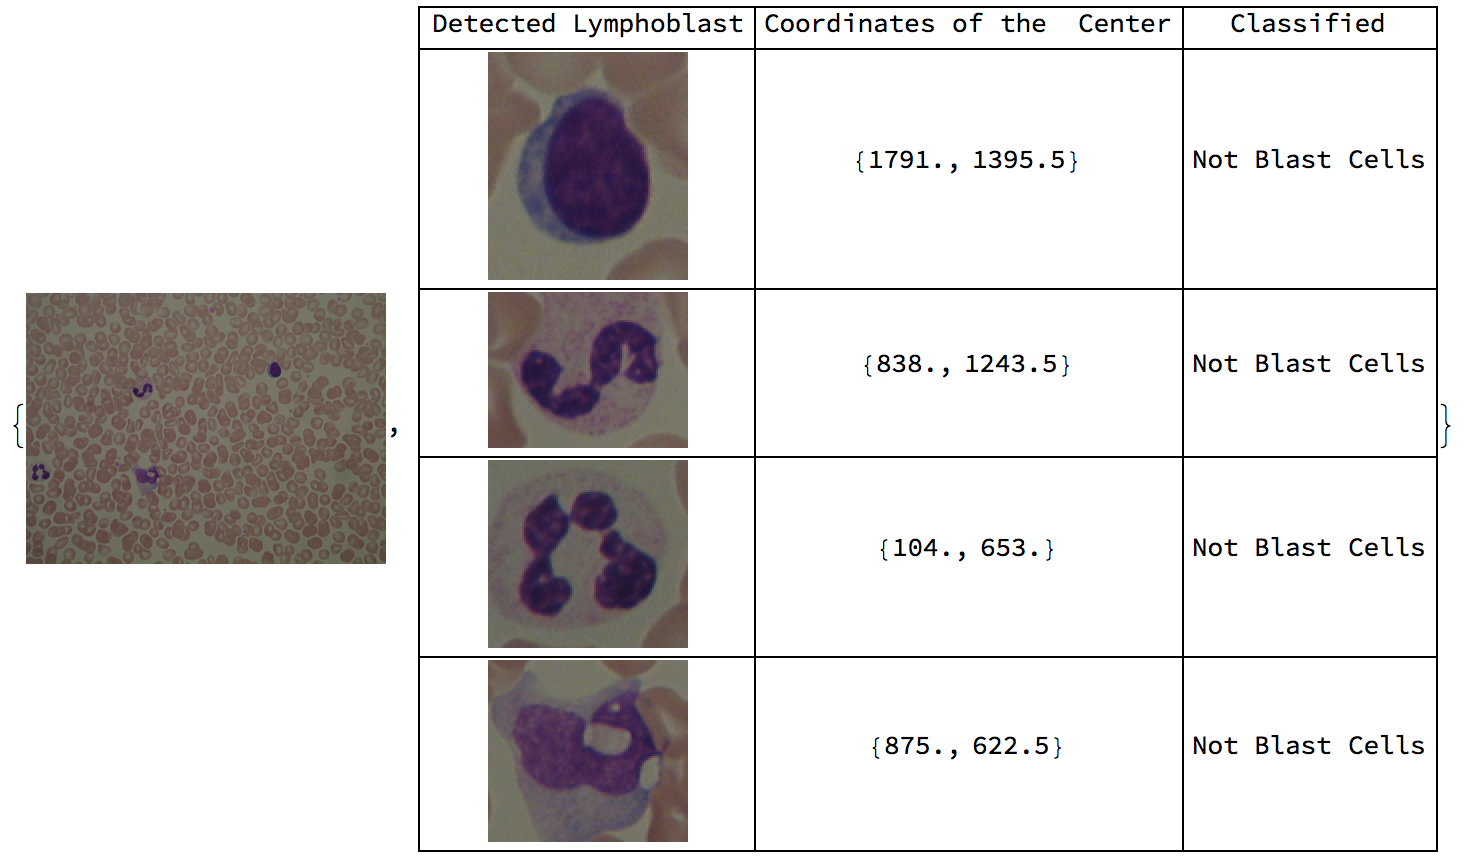
Here are sample results of the function overall. 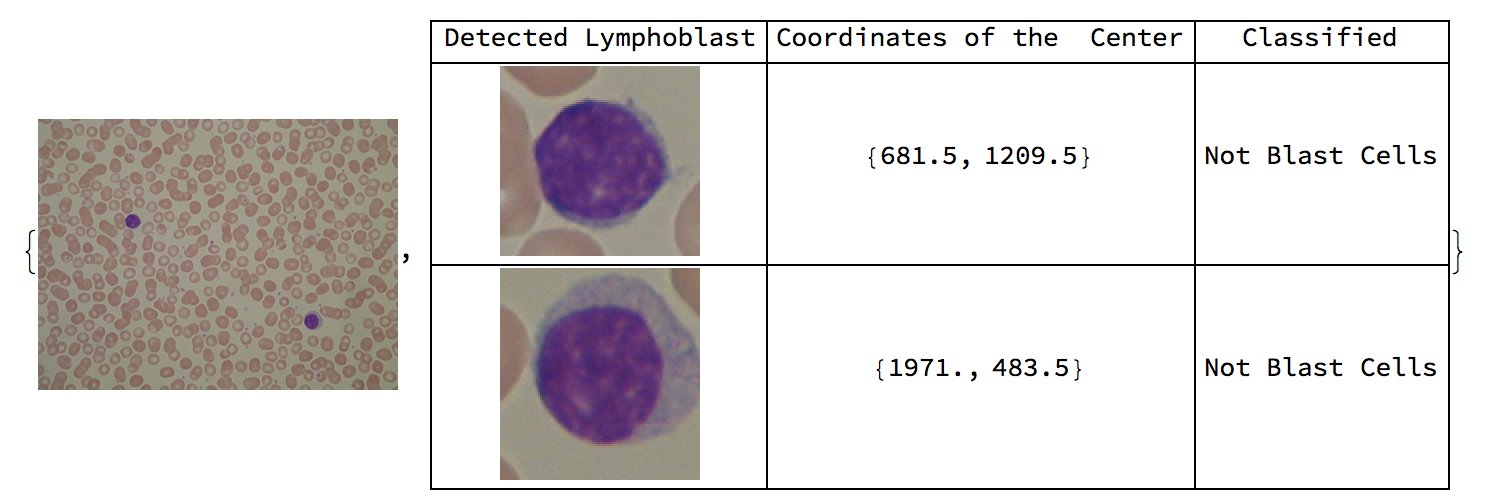
Conclusion
The original purpose of this project was to diagnose ALL from blood images. It was found that both the classifier and supporting functions were quite applicable for the purpose, specifically, with the classifier having an accuracy measure of 98.1%. The classifier was trained on various lymphoblasts and lymphocytes with diverse features, making it more robust. Peripheral blood smear images that contain blast cells came with labels which caused several errors in the algorithm. It was not possible to remove the labels from the images, and the image processing functions failed to produce expected results. In contrast, when the algorithm was tested on 59 blood images of healthy patients, the algorithm identified all of the lymphocytes through image processing and had a 100% accuracy in classifying them as lymphocytes.
Here is my computational essay. Please download both Data.nb and FinalProjectNBTemplate.nb.
Future Works
In order to improve the project, data collection from local hospitals will be conducted. Here, I plan to obtain pictures of the entire blood slide of each patient, so that my project can be extended to diagnosis of the disease. Also, I will obtain original images of peripheral blood smears of patients with ALL to test my algorithm, since the images I obtained from ALL-IDB came with labels. Peripheral blood smears of patients without ALL will also be acquired to get a more Further, I will apply the algorithm to not only patients with ALL but also those who have AML and MDS, which are types of blood cancer.
Acknowledgements
I acknowledge Dr. Fabio Scotti from the University of Milan for providing me with the dataset to work on.
I acknowledge my mentor Eryn Gillam for providing me with ideas about what to code in order to solve this problem and revising my presentation script & this document.


