Abstract
The project aims at extracting features from a function plot and expressing them using different representations to provide a consistent machine translation process. This work evaluates a function at different levels using a set of pre-built functions and mathematical methods. The extracted features were then mapped to a meaningful paragraph. Different machine learning algorithms were evaluated on a randomly generated dataset to classify curve plots. A sonification function was implemented to synthesize the graphs. The algorithms were tested on a set of functions and plots and showed the desired results for continuous polynomial and trigonometric functions. The machine learning solution was able to generate a robust discriminative model despite the data scarcity.
Introduction
One of the most important tasks in data analysis and statistics is to describe a plot in a way that expresses the parameters of a function and the change in its variables. Automating this process is still an open-ended problem that has been tackled in a number of ways. A graph provides a sequence of features about the function behaviour within a predefined domain. Extracting these features, however, and transforming them into natural language is a a harder sub-problem due to its ill-defined constraints. This work explores a set of approaches to reduce the task and optimize its final caption.
Methods
A heuristic approach
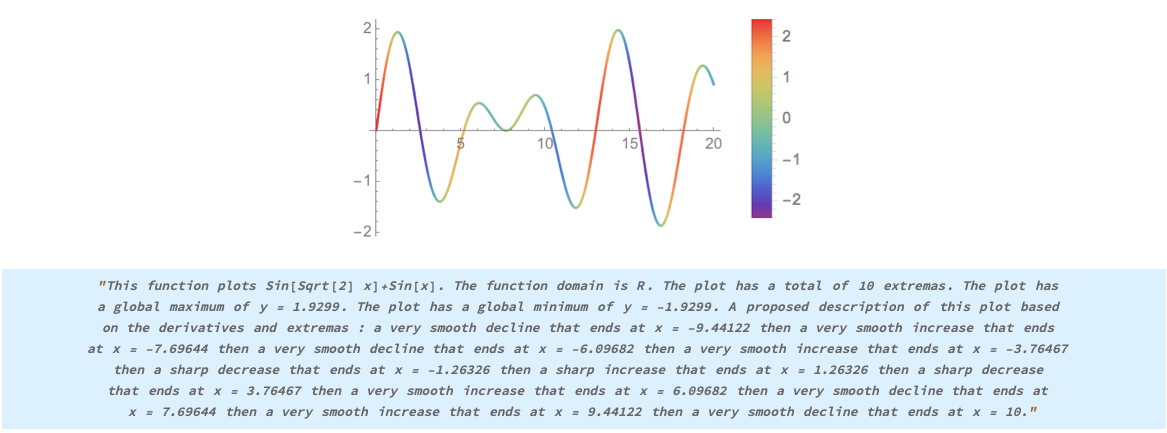
The designed program takes as input the function expression and explores a set of mathematical methods that evaluates the local and global extrema, the domain, the periodicity and the exponent. To extract these features, the algorithm evaluates the function at points where D[f[x],x]==0 and D[f[x],x,2]>=0 for maximums and D[f[x],x]==0 and D[f[x],x,2]<=0 for minimums within the predefined range. Based on the maximums and minimums of a given plot, the algorithm splits the function into intervals and samples these intervals over a list of points. By calculating the mean of the scaled derivative at each of these points and lower bounding it to the nearest threshold, the algorithm approximates the evolution of that function and its rate. A set of sentences were concatenated to produce a final meaningful paragraph.
MaxMin[xa_,na_,sa_]:= Module[
{max,min,nice,max1,min1,df, global,global1,global2,global3,intervals,dal,dont,strings,expression,final,final1,fn,globalmax,globalmax1,globalmin,globalmin1,justreturn,finala},
    fn = ToExpression[xa];
    max = x/. N[List[Solve[{na<=x<=sa, D[fn,x]==0,D[fn,{x,2}]<=0},x]]]//Flatten
    min= x/.  N[List[Solve[{na<=x<=sa, D[fn,x]==0,D[fn,{x,2}]>= 0},x]]] // Flatten;
    nice = StringJoin["The plot has a total of ",ToString[Length[max]+Length[min]]," extremas. "];
    max1 = Table[{{max[[x3]],Round[fn/. x-> max[[x3]],0.0001]}},{x3,1,Length[max]}];
    max1=  N[Flatten[max1,1]];
    globalmax = SortBy[max1,Last,Greater];
    globalmax1 = "The plot has a global maximum "<>"of y = "<>ToString[globalmax[[1,2]]]<>". ";
    min1 = Table[{{min[[x3]],Round[fn/. x-> min[[x3]],0.0001]}},{x3,1,Length[min]}];min1 =           N[Flatten[min1,1]];
    globalmin = SortBy[min1,Last];
    globalmin1 = "The plot has a global minimum "<>"of y = "<>ToString[globalmin[[1,2]]]<>". ";
    {min,max}={NMinValue[{D[fn,x],na<=x<=sa},x],NMaxValue[{D[fn,x],na<=x<=sa},x]};
    df=Rescale[D[fn,x],{min,max},{0,1}];
    global =x/.N[ List[Solve[{na<=x<=sa, D[fn,x]==0},x]]] // Flatten;
    global = Sort[global];
    global2 = Insert[global,na,1];
    global1 = global2[[2;;Length[global2]]];
    global3 = Insert[global1,sa,Length[global1]+1];
    intervals = Transpose[{global2,global3}];
    dal = "A proposed description of this plot based on the derivatives and extremas : ";
    dont = Table[Mean[Table[df/. {x-> x1} , {x1,intervals[[n,1]],intervals[[n,2]],0.01}]],{n,1,Length[intervals]}];
    strings = List["a very sharp decrease","a sharp decrease","a smooth decline","a very smooth decline","a smooth decline/increase or most likely no change at all","a very smooth increase","a very smooth increase","a smooth increase","a sharp increase","a very sharp increase"];
    final = Table[{strings[[If[((dont[[x]]>=  0.5)|| (dont[[x]] < 0.1)),(Round[dont[[x]],0.1]*10)+1, (Round[dont[[x]],0.1]*10 )]]]," that ends at x = ",ToString[intervals[[x,2]]]," then "},{x,1,Length[dont]}];
    final1 = final// Flatten;
    justreturn = StringJoin[nice,globalmax1,globalmin1,dal,final1];
    finala = StringTake[justreturn,{1,Length[justreturn]-7}]<>".";
    Sow[finala,"speak"];
]
Sonification of the results
The inspiration of this task came from the possible correlation between image and sound. An audible signal could be a relevent data source for visually impaired people in order to picture the function behaviour. After sampling the points from a plot, scaling the y-values and wrapping them around a time series, "AudioGenerator" was used to map them to an audio signal for a duration t.
xa = TimeSeries[
    Cases[
        (List@@Plot[(Sin[Sqrt[2]*x]+Sin[x] * 500,{x,1,20}]),
        _Line,{0,Infinity}
    ][[1,1]]
]
A machine learning approach
Feature extraction on a defined function within a pre-defined domain is a relatively simple task. However, designing a program that highlights plots' features and generates a meaningful caption from a given graph is a more complex problem. The problem was reduced to a multi classification sub-problem. A supervised learning methodology was used to solve it. Automatically describing the content of an image is in fact a fundamental problem in artificial intelligence that connects computer vision and natural language processing. Meanwhile, curve captioning using deep learning needs a huge amount of natural sentences and semantic knowledge which is indeed time consuming. This work introduces a simple application of machine translation that aims at mapping a plot to its shape.
Data collection
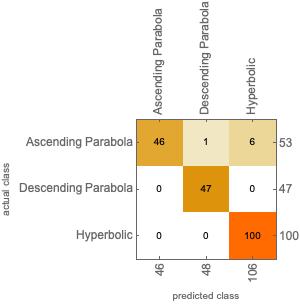
An algorithm was developed to generate a set of random coefficients for quadratic and hyperbolic functions and their corresponding plots within a pre-defined x-range. The images were binarized to provide a more contextual data representation. A training set of 1000 labeled examples and a testing set of 100 labeled examples were created. Three target classes were evaluated : "Ascending Parabola","Descending Parabola" and "Hyperbolic".
(*Random coefficients*)
na = Table[RandomInteger[{-1000,1000}],1000];
xa = Table[RandomInteger[{-1000,1000}],1000];
da = Table[RandomInteger[{-1000,1000}],1000];
exp = Table[RandomInteger[{-100,100}],1000];
(*trainset generation*)
association = Table[Binarize[Plot[ ((da[[xal]])*(x^2))+x*xa[[xal]]+exp[[xal]],{x,-10,10},Axes-> False,PlotRange->{-1000,1000}]]-> If[(da[[xal]])>0,"Ascending Parabola","Descending Parabola"],{xal,1,1000,1}];
association1 = Table[Binarize[Plot[ (da[[xal]]+(x))/(x)+na[[xal]],{x,-10,10},Axes-> False,PlotRange->{-1000,1000}]]-> "Hyperbolic",{xal,1,1000,1}];
TrainSet =Join[association,association1];
Experiments
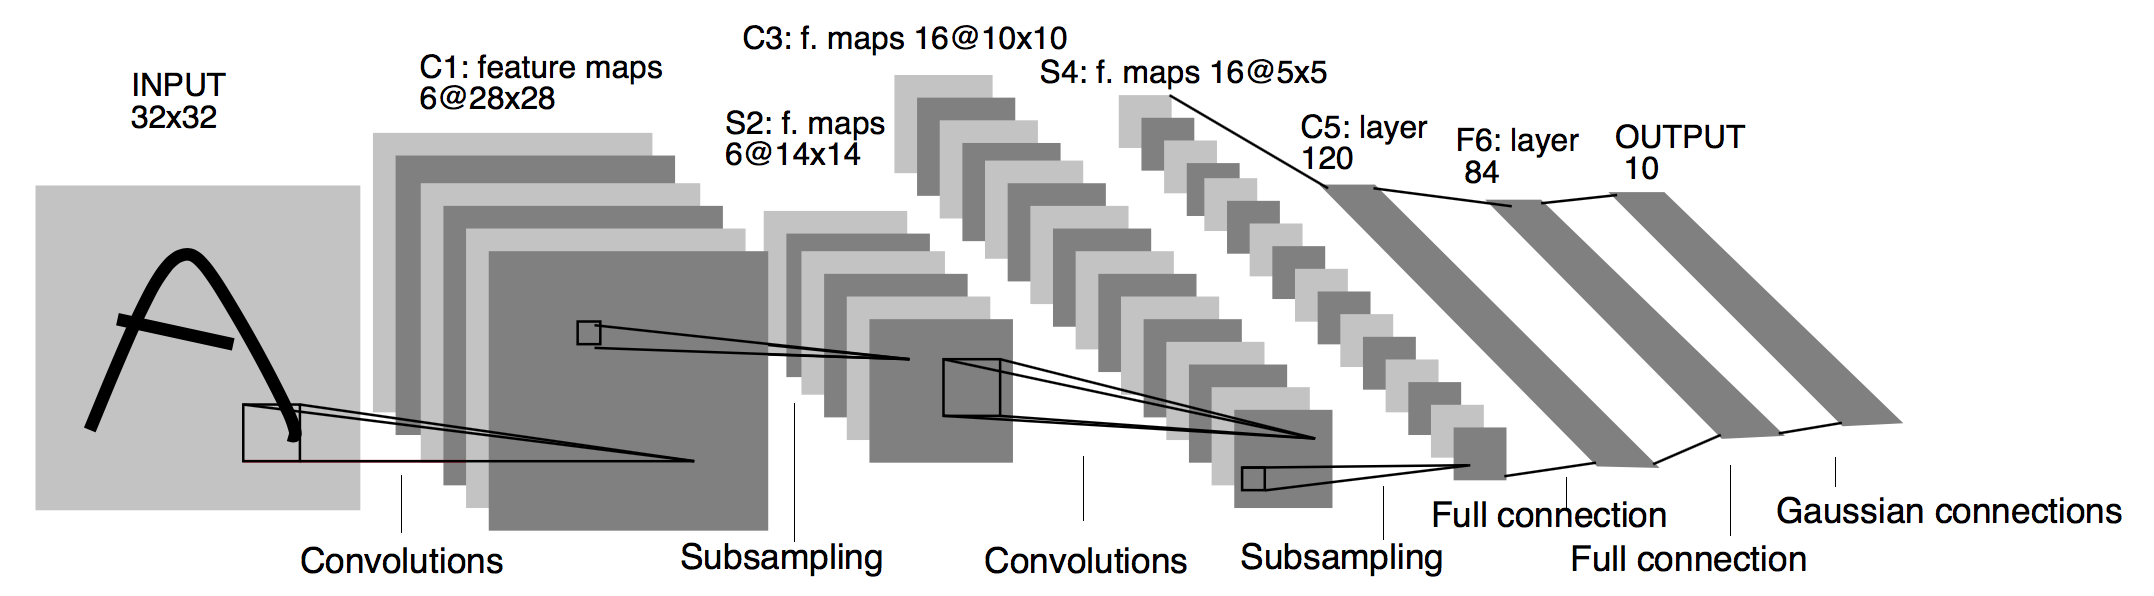
The pre-built "Classify" function was first used to fit the data. Fine-tuning was then performed on the pre-trained "Resnet-50" and "Inception-V3" collected using the neural network repository. The final softmax layers were removed and replaced by a new set of fully connected layers with random initializations. From there, all layers below the head are frozen so their weights cannot be updated. The net was then trained using a very small learning rate so the new set of fully connected layers can learn patterns from the previously learned CONV layers earlier in the network. This process is called allowing the FC layers to "warm up". The overall method is called "network surgery". A custom model architecture similar to "Le-Net" was implemented to evaluate the dataset. The model architecture consists of two convolutional blocks each consisting of a convolution layer, a pooling layer and "Relu" as an activation function.
 The net was trained using cross entropy for 1000 iterations with an initial learning rate of 0.1 .
uninitializedLenet=NetChain[
    {ConvolutionLayer[20,5],
    ElementwiseLayer[Ramp],
    PoolingLayer[2,2],
    ConvolutionLayer[50,5],ElementwiseLayer[Ramp],PoolingLayer[2,2],FlattenLayer[],
    LinearLayer[500],ElementwiseLayer[Ramp],
    LinearLayer[3],DropoutLayer[0.6],SoftmaxLayer[]},
    "Output"->NetDecoder[{"Class",{"Ascending Parabola","Descending Parabola","Hyperbolic"}}]];
trainedNet12=NetTrain[uninitializedLenet,All,TrainSet,ValidationSet->ValidationSet];
Results
The heuristic approach demonstrated good results when tested with trigonometric and polynomial continuous functions. There are still some upgrades to implement before this code is ready for wide scale use. The generated sounds showed a correlation between the actual plot and the audio signal. The "Classify" function outperformed all other methods when it comes to the accuracy metrics from the test set. Neither of the three methods achieved less than 80%. Dropout increased the accuracy by a general factor of 1 which explains its impact on the weights' robustness. There was no evidence of overfitting as the validation set tracked the training set during the training regimen. I tried visualizing the results using the ROC curve, the confusion matrix plot, the error rate and the precision.
Future enhancements
Extending this work to times series plots could have end-to-end impacts on a wide range of research fields. I think that generalizing these methods to other heuristic solutions in image captioning and integrating these techniques in a large platform for the visually impaired people could provide a life-changing experience for them.
Acknowledgement
I sincerely thank my mentor, Jeremy Stratton-Smith, for providing invaluable guidance to help me carry out the project.
 Attachments:


