Abstract
Cryptocurrency values are notoriously unpredictable with traditional financial approaches, which is why they are known as volatile. However, just like any other stock, cryptocurrency values are driven by supply and demand. One of the best ways to look at a cryptocurrencys supply and demand is by examining the cryptocurrencys blockchain data. The goal of this project was to utilize historical blockchain activity to construct a machine learning algorithm that would be able to optimize intraday cryptocurrency portfolio allocations.
Structure
The first part of the project was to create a program that would find the optimized portfolio of just Ethereum and Bitcoin for the current date that the code was executed. The optimization would be done so that the user would be investing with the maximum expected return with a minimal risk, which would be computed with the Sharpe Ratio.
The second part was to create a manipulate of the optimized portfolio to show to a user that the optimized portfolio's weights for the cryptocurrencies could not be beat. The manipulate was then opened up so that the user could change the circumstances of the program and the optimized portfolio would show the optimum weights of the cryptocurrencies.
Following that, historical blockchain data would be collected for optimized portfolios to be inputted into a neural network to attempt to predict future bitcoin return rates, which would then be used to compute an optimal portfolio. However, we will see later why this approach failed and why another approach was more successful.
Computing Optimized Portfolio:
To collect Bitcoin and Ethereums historical values, the FinancialData and TimeSeriesResample functions were used to collect the data and remove data from dates that were not common amongst both cryptocurrencies.
portfolio = {"BTC", "ETH"};
data = FinancialData[#, {{2010}, {2020}}] & /@ portfolio;
data = TimeSeriesResample[{data[[1]], data[[2]]}, "Intersection"];
The optimization function will require the historical return rates of both Bitcoin and Ethereum, the Standard Deviation of both Bitcoin and Ethereum, and the correlation between the 2 cryptocurrencies. These can all be calculated using functions in the Wolfram Language.
returns = Differences@*Log /@ data[[All, All, 2]];
btcSD = StandardDeviation[returns[[1]]] ;
ethSD = StandardDeviation[returns[[2]]];
correlated = Correlation[returns[[1]], returns[[2]]];
Detour: What is correlation? Why is it important?
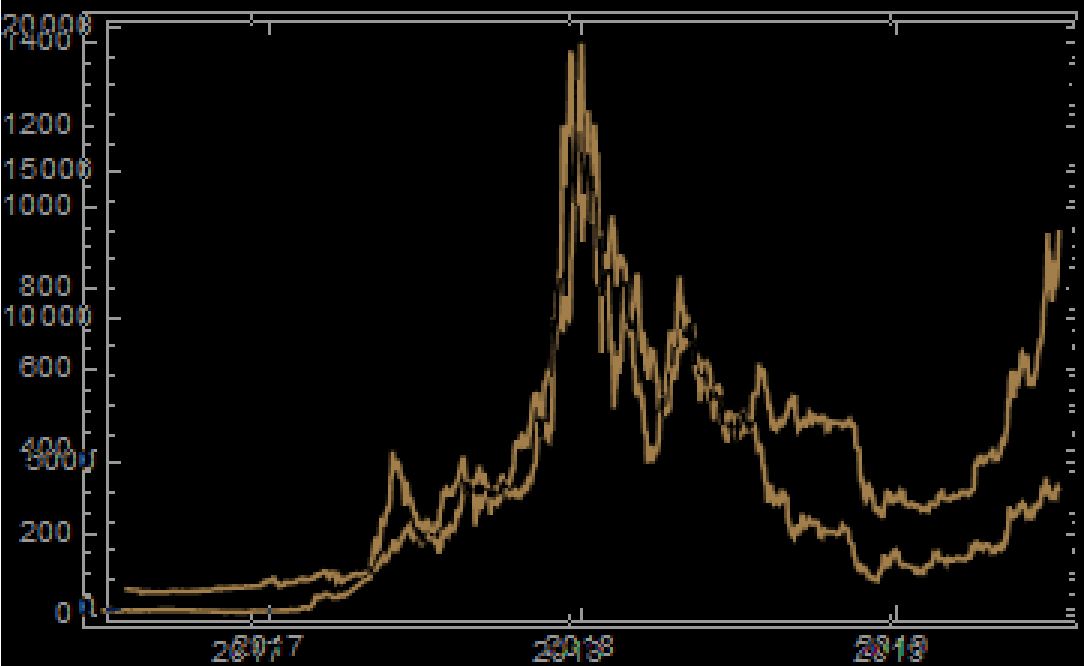
In the above graph, we can clearly see that Ethereum and Bitcoin values fluctuate in similar patterns, which is what correlation refers to. Optimization requires taking into account correlation to better determine how risky it is to invest.
Continuing on!
The next step is to create a function called optimize that takes the parameters: Bitcoin return rate, Ethereum return rate, Bitcoin Standard Deviation, Ethereum Standard Deviation, and Correlation between the 2 cryptocurrencies. The function optimize will use NMaximize, which is a Wolfram function, to calculate a weight for Bitcoin that will maximize the Sharpe Ratio, which refers to safe an investment is estimated to be. The allocation of funds to Bitcoin is represented by the variable weight, and the allocation of funds for Ethereum is represented by (1 - weight).
optimize[btcreturn_, ethreturn_, btcsd_, ethsd_, correlation_] :=
 NMaximize[{Sqrt[252] (weight*btcreturn + (1 - weight)*ethreturn)/
     Sqrt[btcsd^2*weight^2 +
       ethsd^2*(1 - weight)^2 + (2*correlation*btcsd*ethsd)*
        weight*(1 - weight)], 1 >= weight >= 0}, weight]
Now we can calculate the optimized portfolio for today.
optimize[Mean[returns[[1]]],
 Mean[returns[[2]]], btcSD, ethSD, correlated]
Now, everything can be easily wrapped up into a manipulate that allows a user to change the circumstances of the optimization function, all while showing the optimized portfolio live.
Manipulate[
 Sqrt[252.] (weight*btcreturn + (1 - weight)*ethreturn)/
    Sqrt[btcsd^2*weight^2 +
      ethsd^2*(1 - weight)^2 + (2*correlation*btcsd*ethsd)*
       weight*(1 - weight)] -> (optimize[btcreturn, ethreturn, btcsd,
    ethsd, correlation]), {weight, 0,
  1}, {{btcreturn, Mean[returns[[1]]]}, 0,
  1}, {{ethreturn, Mean[returns[[2]]]}, 0, 1}, {{btcsd, btcSD}, 0,
  1}, {{ethsd, ethSD}, 0, 1}, {{correlation, correlated}, 0, 1}]
Collect Data for Machine Learning
To collect data for machine learning, we must import Bitcoins transaction history and format it to work correctly as a TimeSeries. The variable BTCtransData below contains the formatted data. The data that is used is originally from Bitcoinity, but is being imported from my GitHub for this project.
BTCtransData =
  TimeSeries[{Take[First[#], 3], #2} & @@@
    Rest[Flatten[
      Transpose[
       Import["https://github.com/ShivainVij/Cryptocurrency_Machine_\
Learning_Portfolio/raw/master/Dataset/BitcoinTransactionHistory.xlsx",\
 "Data"]], 1]]];
Now that we have the Bitcoin transaction history, we can collect the Bitcoin historical values with FinancialData just like we did at the beginning of the project, and then we can filter it to remove uncommon dates, and finally find all the Bitcoin historical returns.
BTCValuedata = FinancialData["BTC", {{2014, 7, 17}, CurrentDate[]}];
BTCallData =
  TimeSeriesResample[{BTCValuedata, BTCtransData, "Intersection"}];
BTCreturns =  Differences@*Log@BTCallData[[1, All, 2]];
Now that all the data has been collected, we can input everything into a Predict Neural Network so that the Neural Network would take Bitcoin blockchain historical transaction data and predict the Bitcoin return rates.
BTCml = Predict[
   Flatten[Rest[BTCallData[[2, All, 2] ]]] ->  BTCreturns,
   PerformanceGoal -> "Quality", Method -> "NeuralNetwork"];
BTCvar = Rest[BTCallData[[2, All, 2]] ] -> BTCreturns;
BTCpml = PredictorMeasurements[BTCml, BTCvar];
BTCpml["Report"]
The results were fairly disappointing. 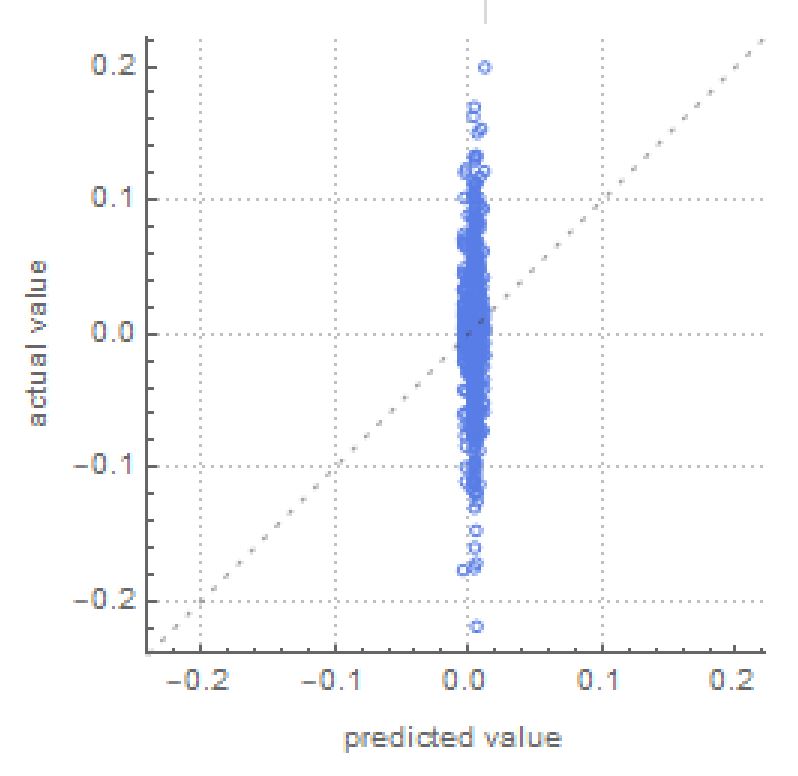
The graph above shows how the Neural Network performed, and it shows that it was mostly guessing the returns as 0, which was consistently incorrect. If the Neural Network was accurate, all the blue points would have been along the dotted line. Even after removing the first 2 years of data, since at that time Bitcoin was not really recognized as a currency and it's data from that time could have influenced the success of the Neural Network since it would have been irrelevant data in relativity to today's recognition of Bitcoin, the Neural Network remained inaccurate. The same results are produced even with Ethereum.
While this does make it appear that there is no correlation between blockchain transactions and value, I decided to further investigate by focusing on monthly values instead of daily values.
Monthly Bitcoin Machine Learning
Just like in the daily method, the first step is to collect data, but this time it would be monthly.
BTCmonthlyTransData = TimeSeries[Rest[Import["https://github.com/ShivainVij/Cryptocurrency_Machine_Learning_Portfolio/raw/master/Dataset/BitcoinMonthlyTransactionData.csv", "Data"]]];
BTCmonthlydata = FinancialData["BTC", {{2016, 7, 1}, CurrentDate[]}];
BTCmonthlyallData =
TimeSeriesResample[{BTCmonthlydata, BTCmonthlyTransData}, "Intersection"];
BTCmonthlyreturns = Differences@*Log@BTCmonthlyallData[[1, All, 2]];
Now we can train another Neural Network and put everything into a graph that we can look at.
BTCmonthlyml = Predict[
Rest[Flatten[BTCmonthlyallData[[2, All, 2] ]]] -> BTCmonthlyreturns,
PerformanceGoal -> "Quality", Method -> "NeuralNetwork"];
BTCmonthlyvar = Rest[BTCmonthlyallData[[2, All, 2]] ] -> BTCmonthlyreturns;
BTCfulllm = LinearModelFit[
Transpose[{BTCmonthlyml[Rest[ BTCmonthlyallData[[2, All, 2]]], "Decision"],
BTCmonthlyreturns}], x, x]
BTCmonthlyml[Reports]
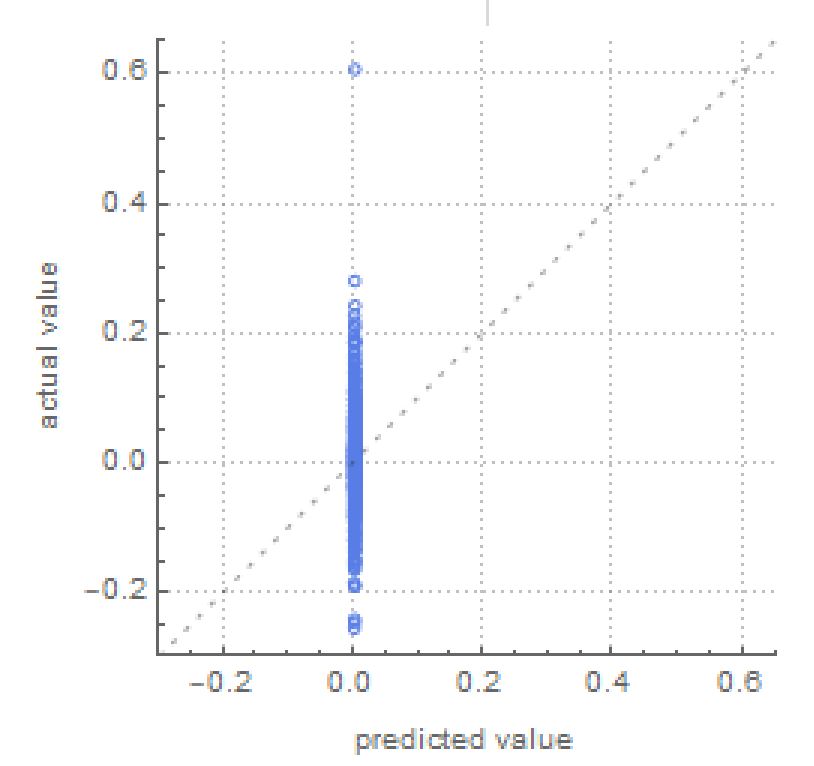
The above shows the results of only looking at monthly data, which is much more accurate than daily. However, monthly data is not very practical. Even so, it does produce quite a promising graph:
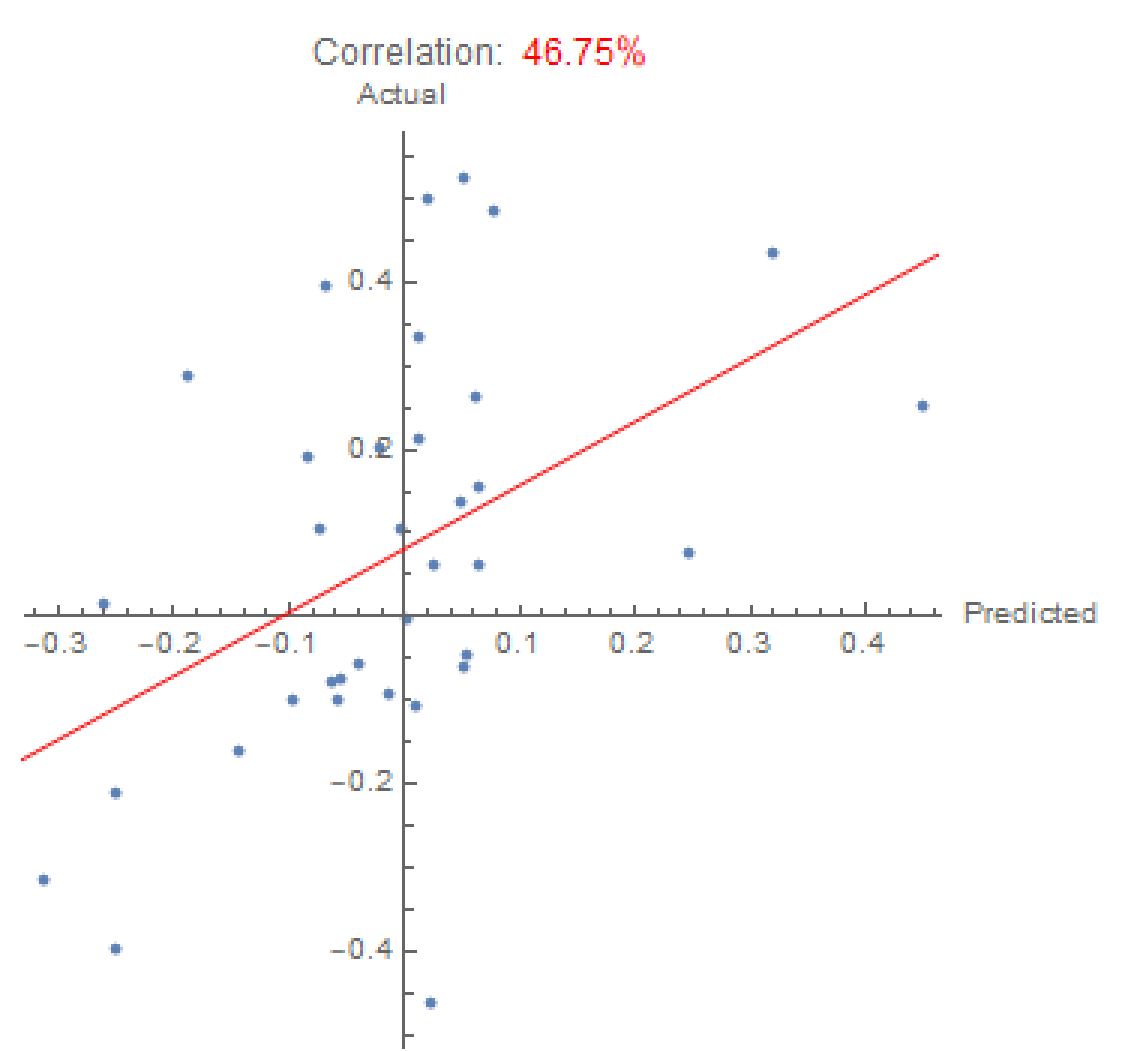
We can see at the top that the Neural Network was able to identify a 46.75% correlation between monthly Bitcoin transaction history and Bitcoin values. This graph shows that the monthly results are significantly better than they were for all of the daily data. We can also find how much the of the variance in return rates that the Neural Network can explain.predicts.
fulllm["RSquared"]
This returns about 20%, which is quite low. Since this does not perform very well, we can continue our exploration. What if we were to only input Bitcoin and Ethereum blockchain transaction data and output the optimized values without finding the returns at all?
Predicting Optimized Values
Firstly, we have to collect all the data for the Bitcoin transaction history, Ethereum transaction history, and Historical optimized values, and then filter out data from uncommon dates. Since we already have the Bitcoin transaction history from our daily Neural Network, we only need to find the Ethereum transaction history and Historical optimized values.
ethData = TimeSeries[Rest[Import["https://raw.githubusercontent.com/ShivainVij/Cryptocurrency_Machine_Learning_Portfolio/master/Dataset/ETHTransactionHistory.csv", "Data"]]]

historicalOptimized = Table[
   date = DatePlus[Today, {EndDate, "Days"}];
   data =
    FinancialData[#, {date - Quantity[21, "Days"],
        date}] & /@ {"BTC", "ETH"};
   dataSelected =
    TimeSeriesResample[{data[[1]], data[[2]]}, "Intersection"];
   returns = Differences@*Log /@ dataSelected[[All, All, 2]];
   btcSD = StandardDeviation[returns[[1]]] ;
   ethSD = StandardDeviation[returns[[2]]];
   correlated = Correlation[returns[[1]], returns[[2]]];
   optimize[Mean[returns[[1]]], Mean[returns[[2]]], btcSD, ethSD,
    correlated]
   , {EndDate, -600, 0, 1}] ~
  Monitor~{date - Quantity[21, "Days"], date}

transpose =
 Take[Transpose[{Rest[ETHallData[[1, All, 2] ]],
    Rest[BTCallData[[1, All, 2]] ]}], -Length[listedHistoricalOptimized]]
Now that all the data has been collected, it can all be inputted into a Neural Network.
optalldata =
  TimeSeriesResample[{ETHallData[[1]], BTCtransData[[1, All, 2]]}, "Intersection"];
optml = Predict[transpose ->  listedHistoricalOptimized,
   PerformanceGoal -> "Quality", Method -> Automatic];
poptml = PredictorMeasurements[optml,
  transpose -> listedHistoricalOptimized]
Now we can put all the data into an easy to read graph.
optmllm =
 LinearModelFit[
  Transpose[{optml[transpose],  listedHistoricalOptimized}], x, x]

optallCorrelation =
 Correlation[
  Transpose[{optml[transpose],  listedHistoricalOptimized}]]

ListPlot[Transpose[{optml[transpose],  listedHistoricalOptimized}],
 Epilog -> Style[Line[{#, optmllm[#]} & /@ {0, 1}], Red],
 AspectRatio -> 1,
 PlotLabel ->
  Row[{"Correlation:", Style[PercentForm[optallCorrelation], Red]},
   Spacer[2]], AxesLabel -> {"Predicted", "Actual"}, PlotRange -> All]
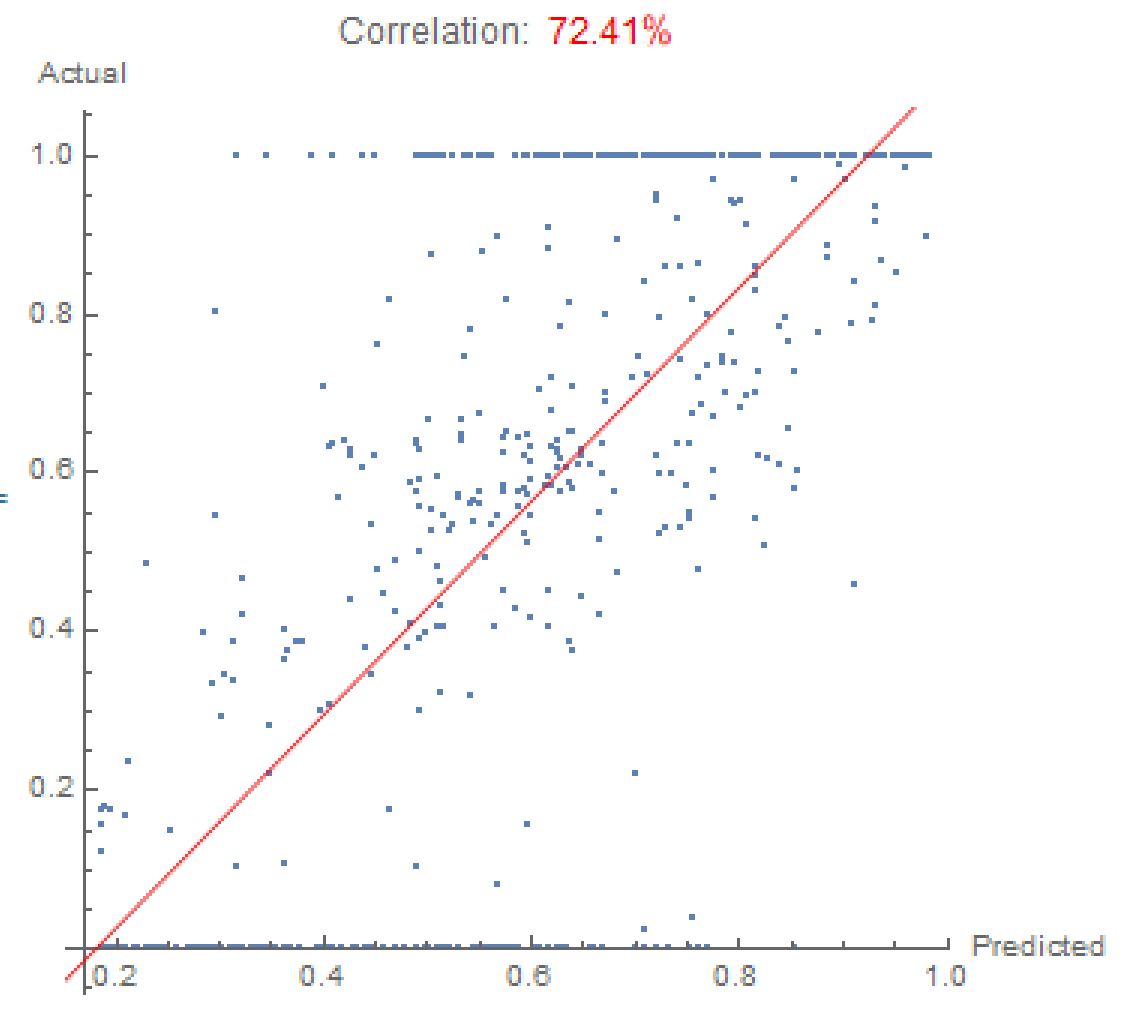
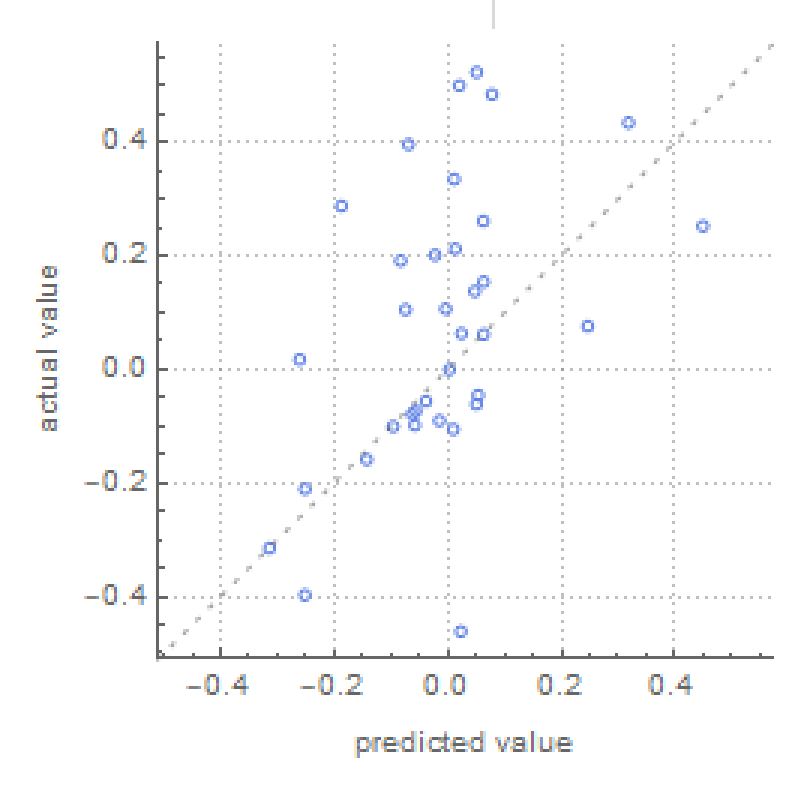
This graph shows over a 70% correlation between blockchain transaction data and the optimized portfolio, which is really strong. In addition, after running the code below, we see that the Neural Network can explain over 50% of the the variance in the optimized portfolio, which is quite successful for a volatile cryptocurrency such as Bitcoin.
optmllm["RSquared"]
Conclusion
In conclusion, Neural Networks can be used to predict optimized portfolios in the future, however they would require much better data. For this, there are many different extensions for the project. One of the many extensions is to take into account new users and old users and trading history of users to identify possible enterprise level transactions, since the enterprises that perform these transactions may not be influenced by the same things that regular individual consumers are. Furthermore, the prices and how many people bought ASICS or any other mining related hardware can also be investigated, since the mining of Bitcoins can impact the blockchain's number of Bitcoin transactions. Shifting our focus to the regular individual consumer, further research could include analyzing news articles consisting of majority of the key words bitcoin prices expected to rise says expert analyst" since phrases such as this can cause a consumer who would normally not be interested in cryptocurrencies to invest. Analyzing the volatility right before cryptocurrency price experiences dramatic change like the bitcoin spike and fork can also provide more insight into what influences consumer confidence in Bitcoin. Finally, adding more cryptocurrencies into the program would also provide more possibilities for the optimized portfolio, but right now, only bitcoin and Ethereum are supported by Wolfram. It is always possible to add more manually using data found online but that data would have to be formatted properly.
 Attachments:


