Abstract
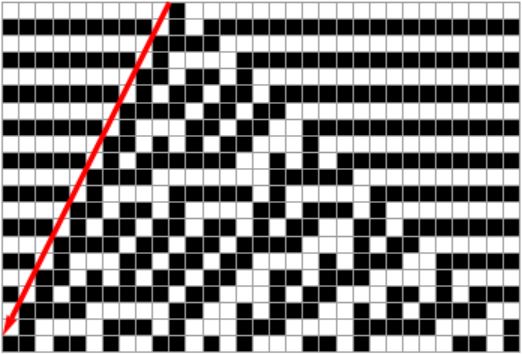
In this post, I will describe my process in examining the repetitive character of diagonal cells in the rule 45 elementary cellular automaton (CA). It is clear that along the left edge of the automaton, a pattern exists as the cells progress diagonally downward. By moving further to the right and studying subsequent diagonals, the patterns detected exhibit increasing periods. This phenomenon is seen in the rule 30 cellular automaton as periods appear to generally increase exponentially with increasing depth. Such period doubling is truly an interesting occurrence, and I studied the existence of similar repetitive behavior in rule 45. To analyze the patterns for especially longer sequences of cells, I devised an efficient algorithm for detecting patterns and their periods in the diagonals. After extracting long sequences of diagonal cells with increasing depth, I employed an algorithmic approach to evaluate the changes in period and examined this data to detect order in the increasing pattern periods.
Properties of the Rule 45 Elementary CA
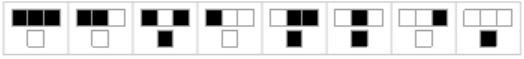
Below is the rule plot for the Rule 45 CA. The neighborhoods are defined as sets of three cells, namely the left, middle, and right cells from the previous generation. As seen in the rule set, each configuration of three cells maps to a black or white cell in the next generation. Although these rules allows us to predict local behavior, it is important to keep in mind that they are not informative of how the automaton will look globally.
Here are 1000 generations of the CA. The initial condition is one black cell in a background of white cells, and future generations are computed using the rule set above.
ArrayPlot[CellularAutomaton[45, {{1}, 0}, 1000]]
I. Initialize Cellular Automaton
Initialize Cellular Automaton
The first step is to initialize our CA.
numgen = 30000;
ca = CellularAutomaton[45, {{1}, 0}, numgen];
The code above generates 30,000 generations of the Rule 45 CA. I needed enough data to extract diagonals long enough to analyze patterns. In other words, the diagonals have to contain multiple instances of repetitive sequences for accurate pattern recognition.
Accessing Data from CA
The function CellularAutomaton generates a grid, or array of 1s and 0s to denote black and white cells. Therefore, we can treat the CA as an array of integers.
CellularAutomaton[45, {{1}, 0}, 20][[3]]
The code snippet above will retrieve the third generation from our CA.
II. Extracting Diagonals
Traversing a Diagonal
In order to pick out diagonals from the CA array, I simply traversed a diagonal of slope two in the CA and created a 1-dimensional list of cells out of the diagonal.
tbl = Table[
  ca[[x + diagnumber - 1]][[
   initpos + diagnumber - 1 - Ceiling[x/2] + 1]], {x, 1, ndiagonal}]
As seen in the code, Table is used to traverse through the diagonal. The variable initpos stores the column of the one black cell in the first generation and diagnumber sets an "offset" to the starting position based on which diagonal is to be traversed (diagnumber refers to the depth of the diagonal from the left-hand diagonal edge of the automaton). Finally, the variable ndiagonal refers to the number of cells per diagonal.
Structure of Diagonal (Visual)
In the image below, I marked the cells of the first diagonal with a red "X". Diagonals are defined as moving two cells south and one cell southwest. This is important because the way we process our diagonals can change our pattern data. 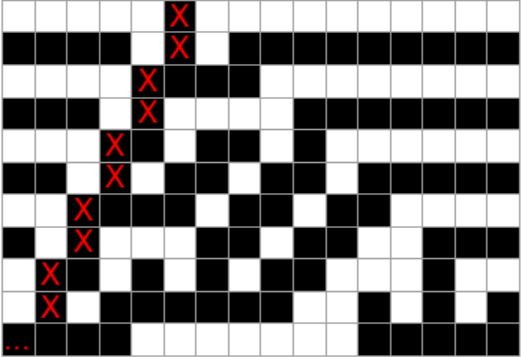
III. Pattern Detection
Using FindTransientRepeat
The next step is to find patterns within the diagonals. However, I realized that some diagonals had some disorder at the beginning, and a repetitive structure (the pattern) only developed later on, so certain short sequences which interfered with the patterns had to be eliminated. Hence, I used the built-in function FindTransientRepeat to identify only the major repetitive sequence within the data.
repseq = FindTransientRepeat[tbl, 2][[2]]
In the code snippet above, repseq will contain a list with elements that occur successively in tbl, which contains the diagonal.
Calculate Pattern Periodicity
To find the period of the data, I simply took the length of repseq.
period = Length[repseq]
Using this process, we can calculate the periodicity of the largest observed pattern in a given diagonal.
Defining the DiagonalPatternPeriod Function
We can wrap the above process in a neat function that will take one argument (the diagonal depth, or number) and return the period of the pattern detected in that diagonal.
DiagonalPatternPeriod[diagnumber_] :=
 Length[FindTransientRepeat[
    Table[ca[[x + diagnumber - 1]][[
      initpos + diagnumber - 1 - Ceiling[x/2] + 1]], {x, 1,
      ndiagonal}], 2][[2]]]
Here is an example call to the function:
In[1]:= DiagonalPatternPeriod[34]

Out[1]= 16
IV. Generating Data for a Range of Diagonals
Naive Approach | O(m*n)
My function DiagonalPatternPeriod retrieves the period for one diagonal, but my aim was to examine period data for a range of diagonals starting from the left diagonal edge of the automaton. Initially, I defined a function named prdlist which would generate a list of periodicity data by running DiagonalPatternPeriod for every diagonal from 1...n.
prdlist[n_] := Table[DiagonalPatternPeriod[d], {d, 1, n, 1}]
Although short and sweet, the above approach was quite inefficient. For n diagonals each of length m, this approach would take O(m*n) time on average, and it therefore ran very slowly for large values of n.
BreakpointSearch - More Efficient Approach | O(m*Log(n))
A key observation I made while examining the pattern periodicity data was that the periods grew quite slowly. I discovered that there were multiple subsequent diagonals that all shared the same pattern periodicity. Because the data contained long stretches of the same value, it seemed inefficient to display huge stretches of data all with the same number. Furthermore, I noticed that the periods were increasing in magnitude, meaning they were naturally in sorted order. These observations motivated an approach where I employed DiagonalPatternPeriod to identify points in the data where the periodicity changes, and I built the list based off of these "breakpoints." I used a modified binary search to calculate these breakpoints which in turn allowed me to generate the list of periods in a more efficient manner.
BreakpointSearch is a function that finds the bounds of the leftmost stretch of one unique element in the interval st...end. Modeled off a binary search, the function can identify breakpoints in approximately log(n) comparisons, which is more efficient in terms of time than the naive approach. Additionally, this algorithm does not compute a long and nasty list full of numbers, but rather provides a condensed version of the list by omitting repeated periodicity values.
BreakpointSearch[st_, stval_, end_, endval_, f_] :=
 If[stval == endval, {end + 1, -1},
  If[st == end - 1, {st + 1, f[st + 1]},
   With[{mid = Floor[(st + end)/2], midval = f[Floor[(st + end)/2]]},
    If[ endval == midval, BreakpointSearch[st, stval, mid, midval, f],
      If[stval == midval,
      BreakpointSearch[mid, midval, end, endval, f],
      BreakpointSearch[st, stval, mid, midval, f]]]]]]

bpoints = {{1, DiagonalPatternPeriod[1]}};

temp =  DiagonalPatternPeriod[n];

While[Last[bpoints][[1]] != n + 1,
 AppendTo[bpoints,
  BreakpointSearch[Last[bpoints][[1]],
   DiagonalPatternPeriod[Last[bpoints][[1]]], n, temp,
   DiagonalPatternPeriod]]]

condensedprddata =
 Table[{bpoints[[x]][[1]] - bpoints[[x - 1]][[1]],
   bpoints[[x - 1]][[2]]}, {x, 2, Length[bpoints]}];
The sequence of commands above generate a condensed list of period data for a range of diagonals. After the search function is defined, a while loop runs to find the successive breakpoints from the left towards the right, and these values are stored in bpoints.
'condensedprddata' contains the condensed version of my periodicity data.
V. Analysis of Period Data
Displaying condensedprddata yields the following result:
{{1, 1}, {2, 4}, {23, 8}, {12, 16}, {7, 32}, {2106, 96}, {1849, 192}}
The data translates to: one diagonal of period 1, then two diagonals of period 4, then twenty three diagonals of period 8, then twelve diagonals of period 16...
Clearly, the data exhibits period doubling. The periodicity doubles from 4 to 8, 8 to 16, 16 to 32, and 96 to 192. This behavior is notable because the diagonals in rule 30 also show period doubling. Additionally, what I found very interesting was the random period tripling when the periodicity changes from 32 to 96. This seemed odd especially because the period tripling abruptly interrupted a sequence of period doubling. I speculate that such period tripling will occur again at a deeper diagonal within the automaton, and perhaps the sequence of period doubling and tripling form a pattern in itself. The cause of this tripling behavior is currently unknown, but I hope to further investigate relationships between the diagonals and their periodicity in the Rule 45 CA.
VI. Visualization of Period Progression
Below, I created a visualization to display my investigation for the first few diagonals. The GIF highlights the first few diagonals and provides data regarding its periodicity. Below the diagram, there is an array showing the pattern (or repeating sequence) and the periodicity of the pattern. When a given diagonal is highlighted, red cells denote the white cells in the automaton, and blue cells denote the black cells in the automaton. Observe the rate, increments, and regions of the automaton in which there exist changes in periodicity.
Future Work
In the future, perhaps I can expand this project by delving deeper into the automaton. Using a machine with more processing power, I hope to generate more generations in my CA and analyze diagonals with higher depths and longer lengths. I want to investigate applications of nonlinear-feedback shift registers to my pattern data and possibly develop a formula or feedback function that can generate data about deeper diagonal patterns in polynomial time.
Github
https://github.com/AniruddhS24/WSS-Template/tree/master/Final%20Project/Final%20Submission
Acknowledgements
Sincere thanks to Nikki Sigurdson for sharing her knowledge of computer science with me and guiding me through this project.
 Attachments:


