Introduction
Molecular Orbital (MO) theory is among the fundamental models describing molecular structures. Chemical reactivity highly depends on two features of MO: the probability distribution, and corresponding energy levels. The goal of this project is to calculate these features for different combinations of atomic orbitals of one-electron diatomic molecules as a function of internuclear distance.
Implementing the Wave Function
$$\psi (\text{n$\_$},\text{l$\_$},\text{m$\_$})(\text{r$\_$},\theta \_,\phi \_)\text{:=}\frac{2 e^{-\frac{r}{n}} \sqrt{\frac{(-l+n-1)!}{(l+n)!}} \left(\frac{2 r}{n}\right)^l L_{-l+n-1}^{2 l+1}\left(\frac{2 r}{n}\right) Y_l^m(\theta ,\phi )}{n^2}$$ You may notice that the wave function accepts Spherical coordinates. This made it difficult to graph because the built in functions for 3D graphs use cartesian coordinates. To get around this issue, the code also includes a function to convert spherical coordinates to cartesian coordinates.
sphericalToCartesian =
 Thread[{r, \[Theta], \[Phi]} -> {Sqrt[x^2 + y^2 + z^2],
    ArcCos[z/Sqrt[x^2 + y^2 + z^2]], Arg[x + I y]}]
Graphing Atomic Orbitals
Using the wavefunction, It is easy to graph a variety of atomic orbitals. For example, using the appropriate quantum numbers it is trivial to graph the S and P orbitals.
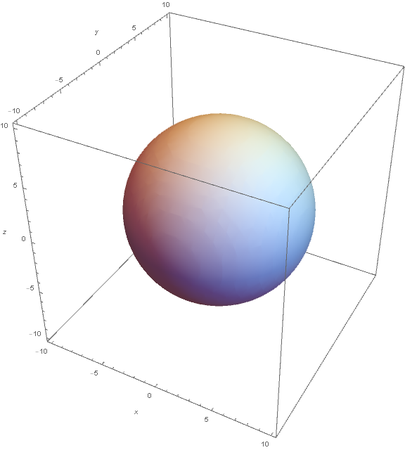
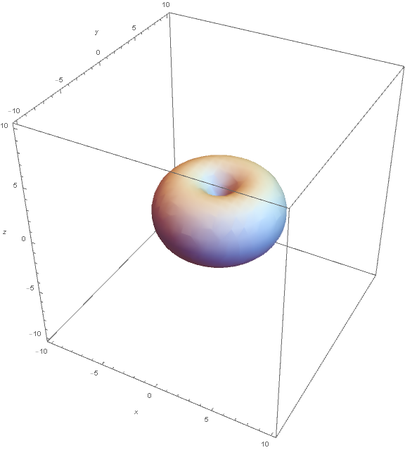
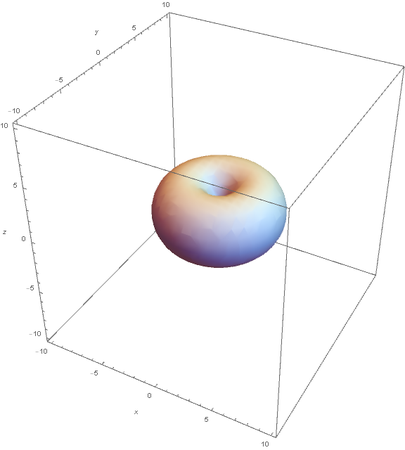
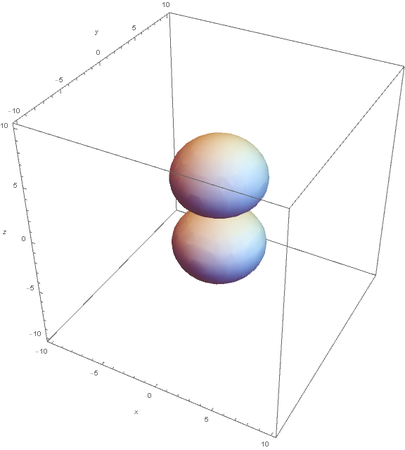
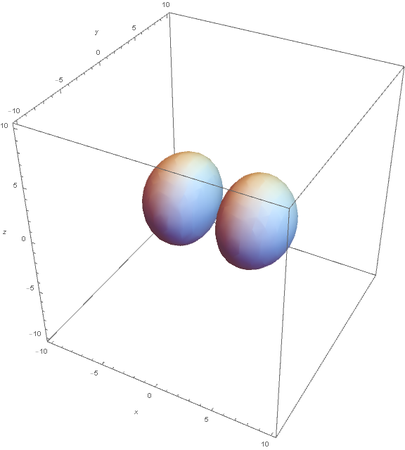
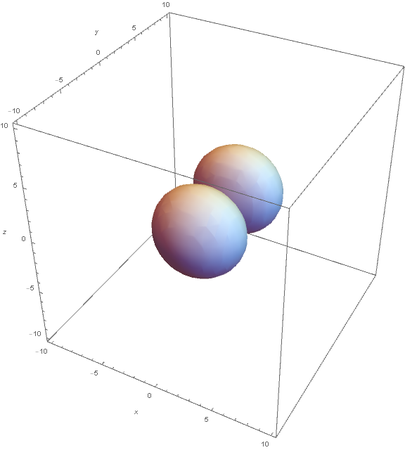
However, the Px and Py orbitals are not the shape most people are familiar with. This is because the wave function produces complex solutions for l=-1,1. To obtain the real solutions, the following calculations are performed on the complex solutions: $$\text{Px}=-\frac{\psi (2,1,1)(r,\theta ,\phi )-\psi (2,1,-1)(r,\theta ,\phi )}{\sqrt{2}}$$ $$\text{Py}=\frac{i (\psi (2,1,-1)(r,\theta ,\phi )+\psi (2,1,1)(r,\theta ,\phi ))}{\sqrt{2}}$$ And graphing those yields the familiar dumbbell shaped P orbitals
Graphing Hybridized Molecular Orbitals
It is also possible to graph hybrid orbitals to observe their shape and orientation. (the latter quality will later allow for some interesting graphs)
SP --
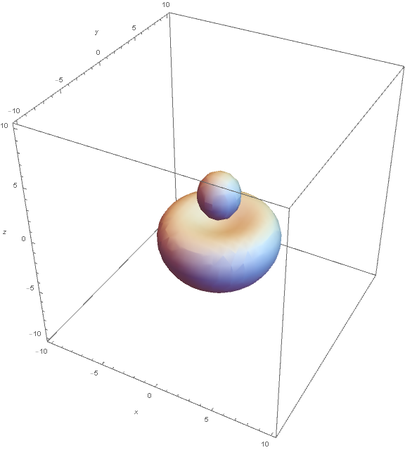
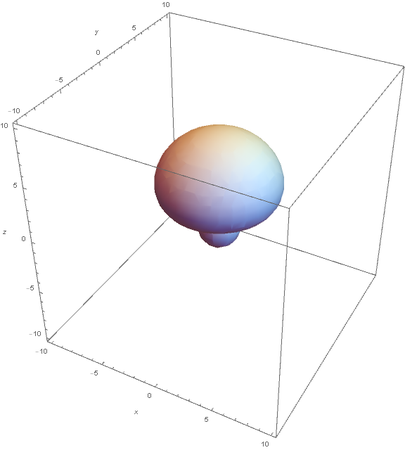
Hybrids of 2S and 2Pz are made by linear combinations of themselves
graph of the remaining 2P orbitals:


Now when I graph all of them at once:
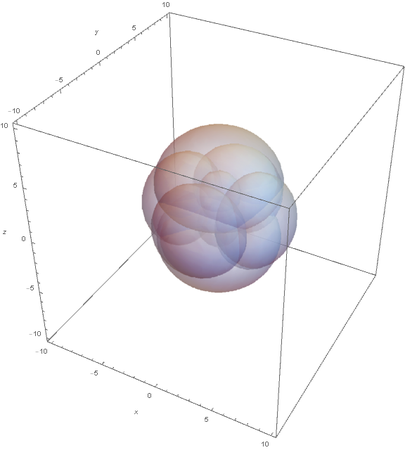
This allows us to see the linear nature of SP hybridized atoms.
SP2
SP2 hybridization:
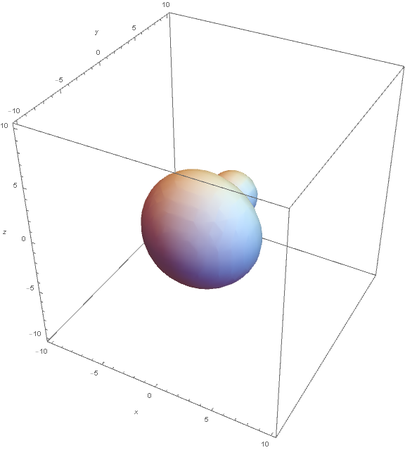
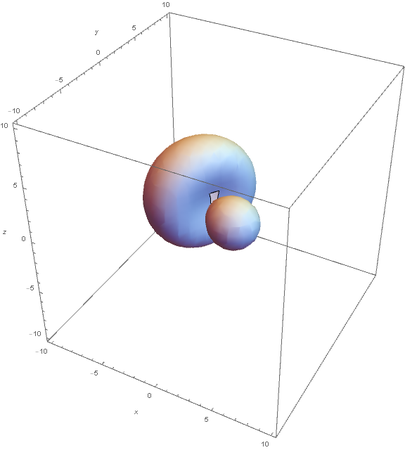
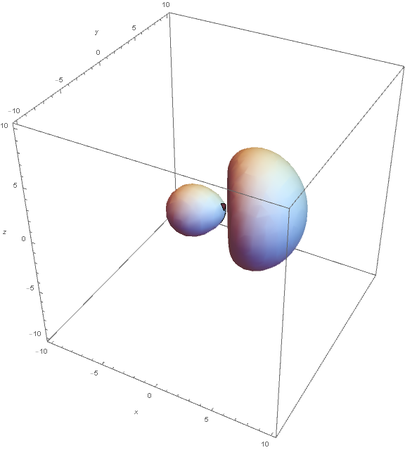

Now overlaying them:
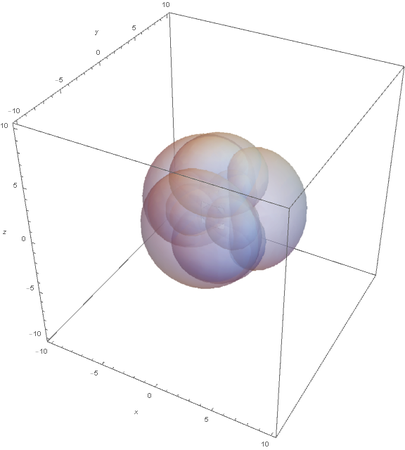
SP3
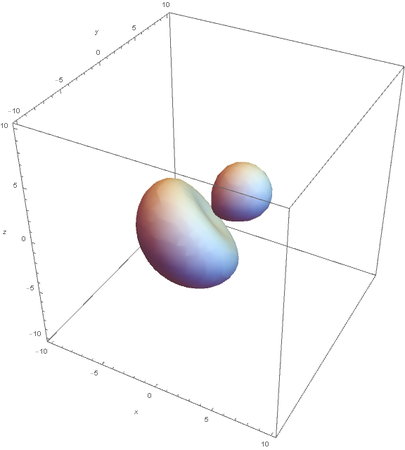
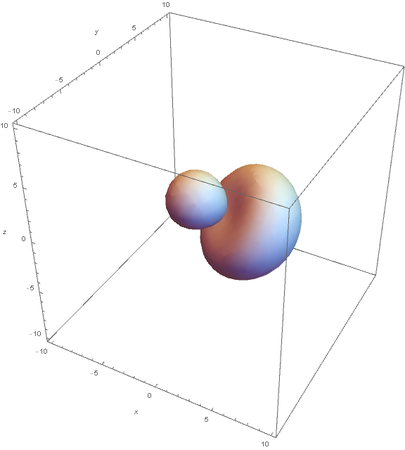
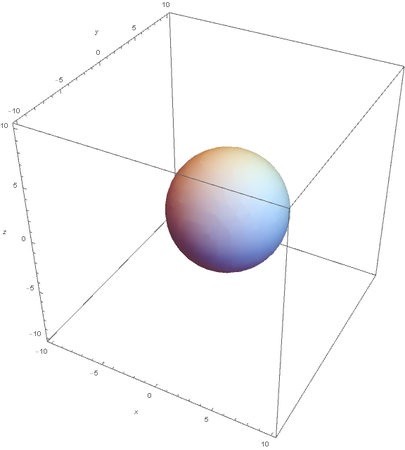
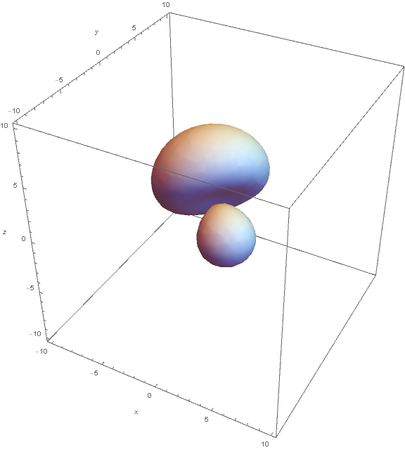
Now overlaying them:
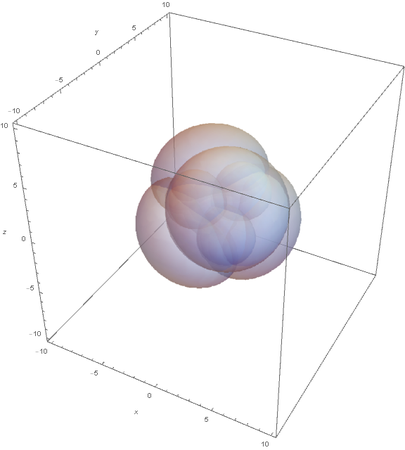
This image clearly showcases the tetrahedral shape of SP3 hybridized atoms
Graphing Molecular Orbitals
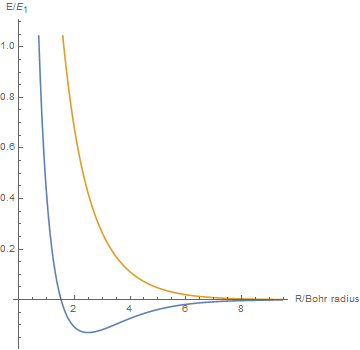
The next step in my project was visualizing molecular orbitals. Using the approximation for constructive and destructive linear combination of atomic orbitals, I numerically calculated the relevant integrals for Hamiltonian, such as overlap, Coulomb, and resonance integrals. With the values of 2x2 Hamiltonian, I found the eigenvalues which are energy levels.
By varying the internuclear distance I obtained a graph that shows how the energy of bonding and antibonding orbitals changes with distance.
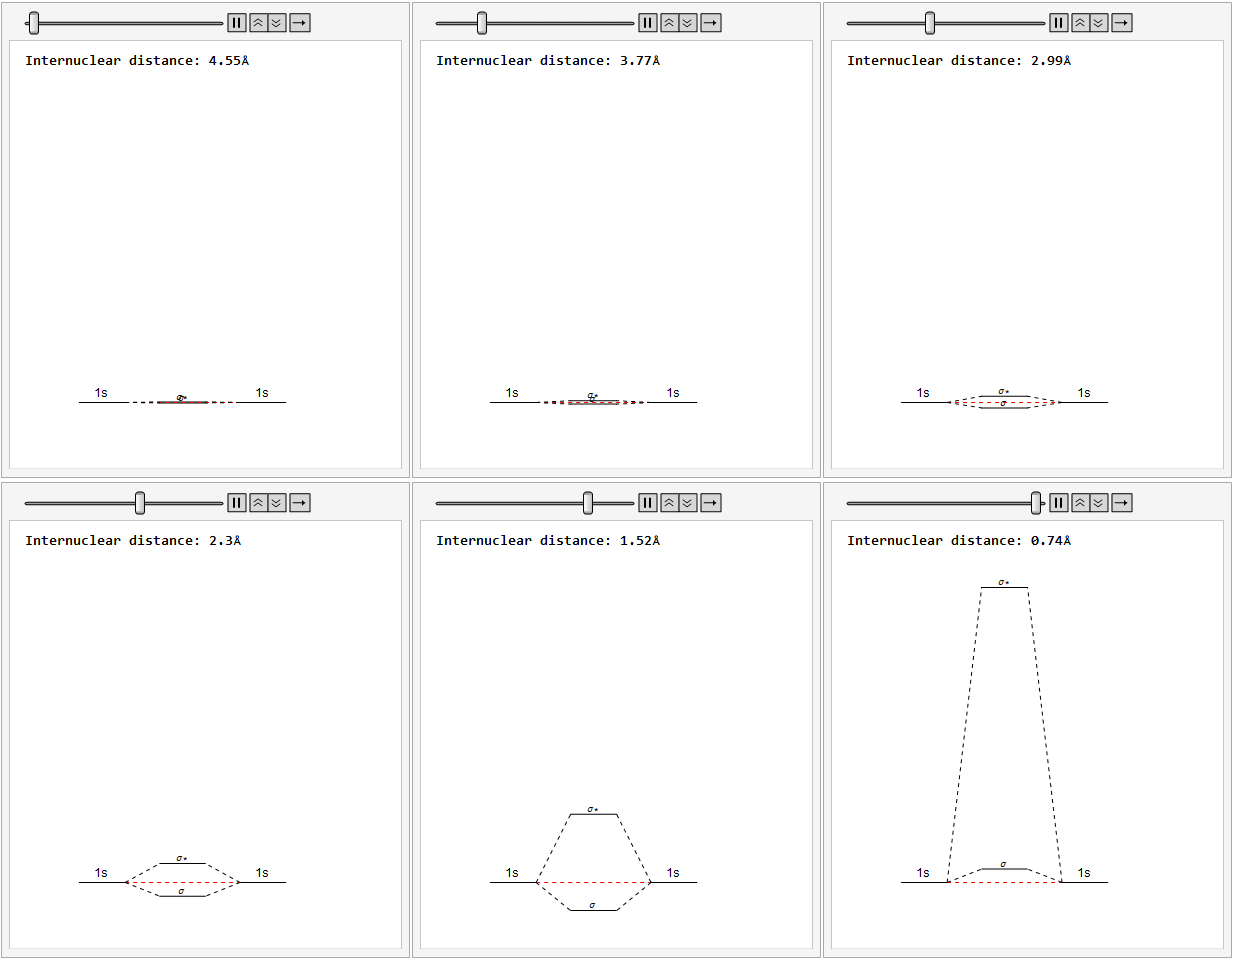
Using list animate, I made this graphic that allows you to visually see how the energies change as the internuclear distance changes.
Finally, using a modified version of the wave function(designed to work natively with cartesian coordinates) I could animate the formation of molecular orbitals as the atoms get closer to eachother.
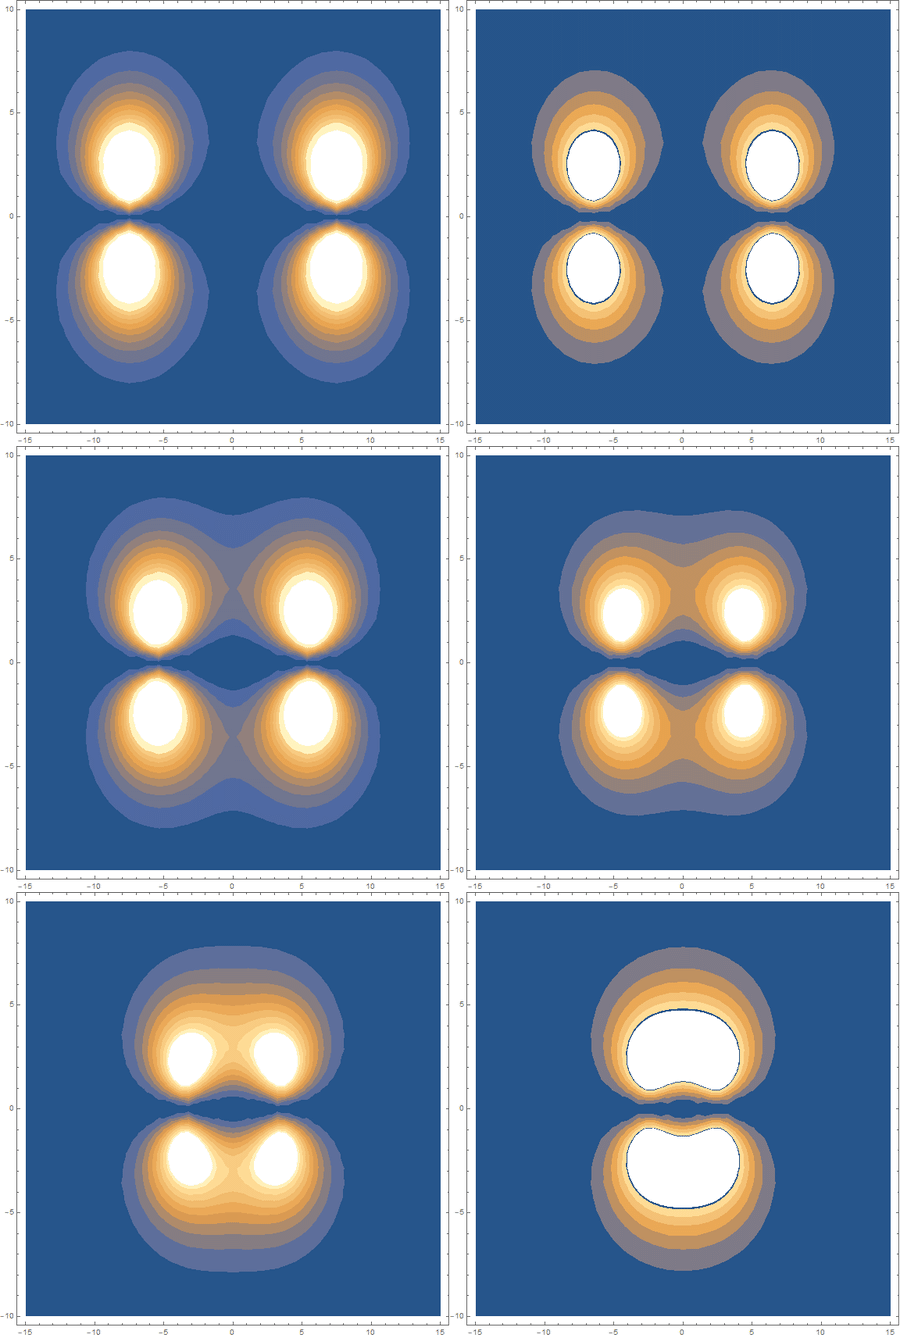
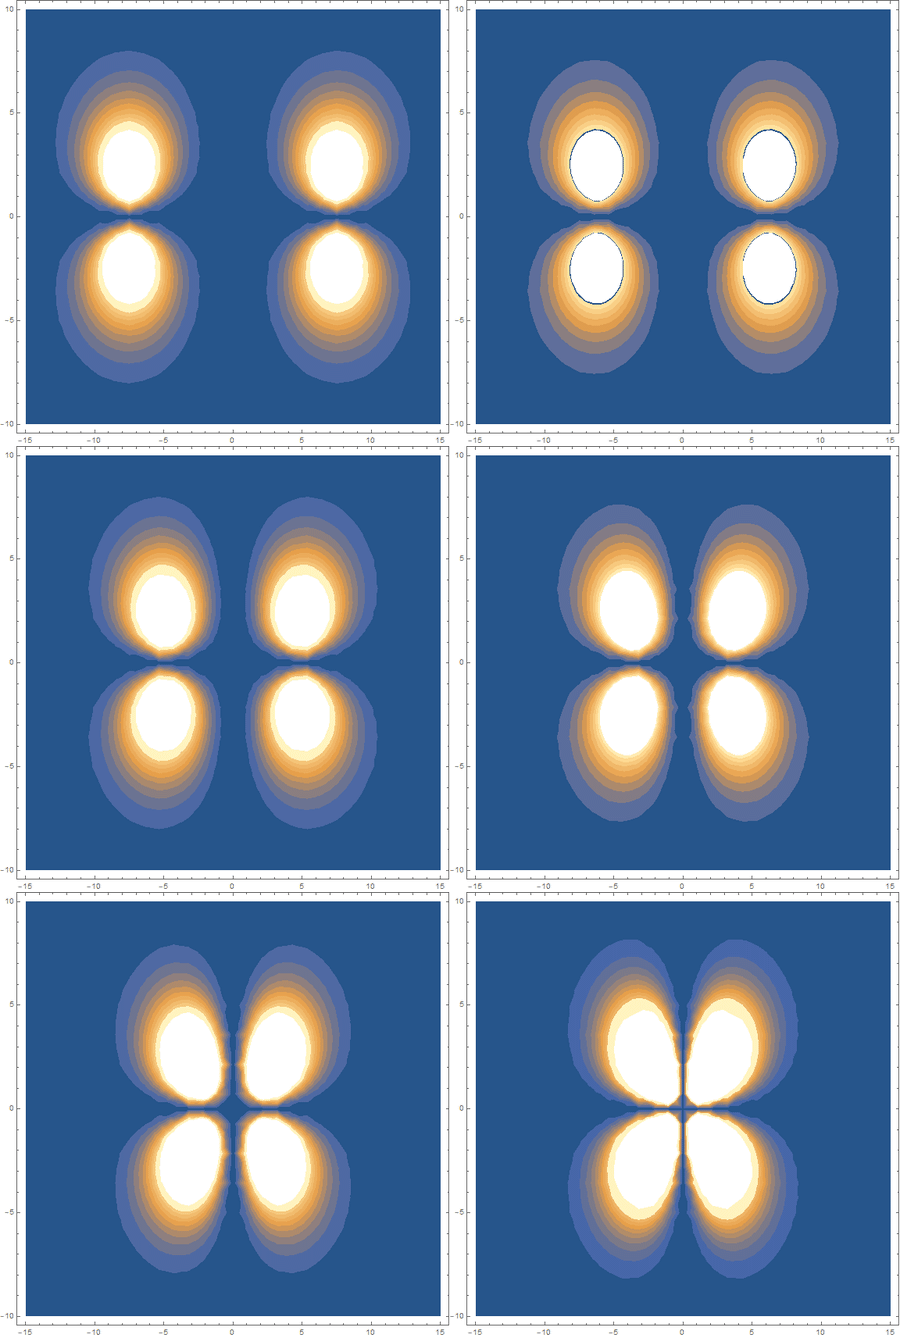
In the first animation, you can see the Pi bonding orbital forming due to the overlap of the two P orbitals, and in the second animation you can see the second nodal plane formed along the y-axis as the Pi anti-bonding orbital is formed
Future Work
The clearest path forward is to graph more complex atoms and molecules; doing so would require more complicated wave functions and much more processing power. Graphing different combinations of atomic orbitals. Another intriguing prospect is predicting the 3D shape of organometallic complexes.
That concludes my look into the inner workings of atoms. I hope you found it as interesting as I did (: