Message Boards Message Boards

1
|
4374 Views
|
6 Replies
|
3 Total Likes
View groups...
Share
Share this post:

[?] Reverse BarLegend colors?

I've made this BarLegend:

BarLegend[{"Rainbow", {15, 45}}, LegendLabel -> "P (m)", 
 LegendMarkerSize -> 200, LegendLayout -> "Row"]

Is there any way to reverse its colors?

Thank you in advance!

6 Replies
Posted 5 years ago

Thanks for clarifying. Reversing the range passed to ColorData seems to work. Yes?

plotz = ListDensityPlot[
   Table[Sin[x y], {x, 0, 3, 0.1}, {y, 0, 3, 0.1}], 
   DataRange -> {{0, 3}, {0, 3}}, PerformanceGoal -> "Quality", 
   ColorFunction -> ColorData[{"Rainbow", {1, -1}}], 
   ColorFunctionScaling -> False, InterpolationOrder -> 1];
bl = Placed[BarLegend[{{"Rainbow", "Reverse"}, {-1, 1}}, 
    LegendMarkerSize -> 200, LegendLayout -> "Row"], Above];
Legended[plotz, bl]

enter image description here

POSTED BY: Rohit Namjoshi

It works!

Clever solution!

Thank you very much Rohit!

Posted 5 years ago
BarLegend[{{"Rainbow", "Reverse"}, {15, 45}}, LegendLabel -> "P (m)", 
 LegendMarkerSize -> 200, LegendLayout -> "Row"]

enter image description here

POSTED BY: Rohit Namjoshi

Thank you very much! It's exactly what I wanted!

However, it doesn't work with ColorData:

ColorData[{{"Rainbow", "Reverse"}, {15, 45}}]
(*ColorData::notent: {{Rainbow,Reverse},{15,45}} is not a known entity, class, or tag for ColorData. Use ColorData[] for a list of entities.*)
Posted 5 years ago

Not sure what you are trying to achieve. If you want to use a different gradient you can use any of the ones supported by ColorData.

ColorData["Gradients"]
(* {"AlpineColors", "Aquamarine", "ArmyColors", "AtlanticColors", 
"AuroraColors", "AvocadoColors", "BeachColors", "BlueGreenYellow", 
"BrassTones", "BrightBands", "BrownCyanTones", "CandyColors", 
"CherryTones", "CMYKColors", "CoffeeTones", "DarkBands", 
"DarkRainbow", "DarkTerrain", "DeepSeaColors", "FallColors", 
"FruitPunchColors", "FuchsiaTones", "GrayTones", "GrayYellowTones", 
"GreenBrownTerrain", "GreenPinkTones", "IslandColors", "LakeColors", 
"LightTemperatureMap", "LightTerrain", "MintColors", "NeonColors", 
"Pastel", "PearlColors", "PigeonTones", "PlumColors", "Rainbow", 
"RedBlueTones", "RedGreenSplit", "RoseColors", "RustTones", 
"SandyTerrain", "SiennaTones", "SolarColors", "SouthwestColors", 
"StarryNightColors", "SunsetColors", "TemperatureMap", 
"ThermometerColors", "ValentineTones", "WatermelonColors"} *)

e.g.

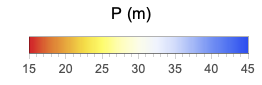
BarLegend[{{"TemperatureMap", "Reverse"}, {15, 45}}, 
 LegendLabel -> "P (m)", LegendMarkerSize -> 200, 
 LegendLayout -> "Row"]

enter image description here

POSTED BY: Rohit Namjoshi

Yes, I think I haven't explained myself very well...

I want to change also the colors accordingly into a ListDensityPlot. Here is an example:

plotz = ListDensityPlot[
   Table[Sin[x y], {x, 0, 3, 0.1}, {y, 0, 3, 0.1}], 
   DataRange -> {{0, 3}, {0, 3}}, PerformanceGoal -> "Quality", 
   ColorFunction -> ColorData[{"Rainbow", {-1, 1}}], 
   ColorFunctionScaling -> False, InterpolationOrder -> 1];
bl = Placed[
   BarLegend[{"Rainbow", {-1, 1}}, LegendMarkerSize -> 200, 
    LegendLayout -> "Row"], Above];
Legended[plotz, bl]

So I need to reverse both the BarLegend and the ColorFunction. The {-1,1} limits are important to be kept for comparison with other plot. However, the technique of Reverse works into BarLegend but not into ColorData.

Thanks again for useful comments!

Reply to this discussion
Community posts can be styled and formatted using the Markdown syntax.
Reply Preview
Attachments
Remove
or Discard

Group Abstract Group Abstract