Hi,
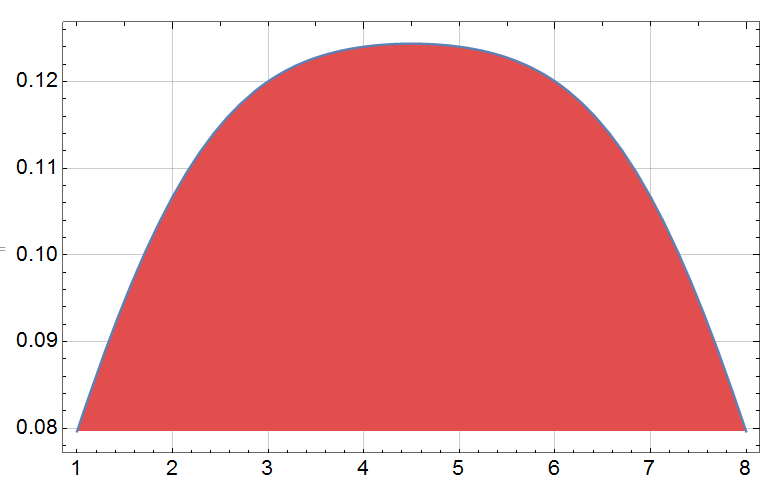
I would like to see the GridLines behind the red region. How can I do that?
Thanks for your help.
col = {Darker[ColorData["Rainbow"][0.25], 0.2],
  Darker[ColorData["Rainbow"][0.4], 0.2],
  Lighter[ColorData["Rainbow"][0.8], 0.25],
  Lighter[ColorData["Rainbow"][1], 0.2]}

list = { 8, 7, 6, 5, 4, 3, 2, 1}

{a, b} = {Min[list], Max[list]}

Plot[PDF[SmoothKernelDistribution@list, x], {x, a, b}, Frame -> True,
 FrameTicksStyle -> Directive[Black, 14], ImageSize -> 500,
 GridLines -> Automatic, Filling -> Bottom, FillingStyle -> col[[4]],
 PlotRange -> All]