There doesn't seem to be any easy way, but everything's possible:
p = Plot[Sin[x], {x, -5, 5}];
Show[FullGraphics[p], ImageSize -> 500,
AspectRatio -> 1/GoldenRatio] /. {
Text[t_, p_, {0., 1.}] :> Text[t, {p[[1]], p[[2]] + .1}, {0, -1}],
Text[t_, p_, {1., 0.}] :> Text[t, {p[[1]] + .25, p[[2]]}, {-1, 0}]
}
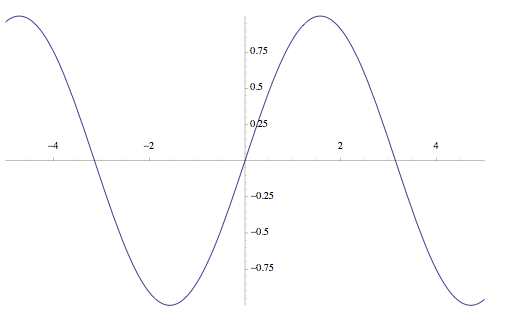
But from what I've read (and according to this quick test)
FullGraphics isn't considered to be a reliable and problem-free Mathematica function. The tick marks have shrunk a bit, for example...


