Message Boards Message Boards

[?] Plot tensor networks diagrams?

Posted 5 years ago

I am trying to draw useful tensor networks in Mathematica (for ex: two of these are shown below). I was not sure that people use Mathematica for this until I came across

GraphPlot[Table[1, {10}, {10}], Method -> "CircularEmbedding", VertexLabeling -> False]

which is a good start. So, I figured there must be some way of taking it from there. I would appreciate any help on this. Thanks. enter image description here

enter image description here

POSTED BY: Raghav Jha
2 Replies
Posted 5 years ago

Thank you @Vitaliy Kaurov for your answer. It is very helpful!

Useful link to play around with branches and levels of the tree - http://demonstrations.wolfram.com/RegularKAryTrees/

POSTED BY: Raghav Jha

You can do something similar. Take a look at the following function:

diagramsJHA[branch_Integer,level_Integer,opts:OptionsPattern[]]:=
KaryTree[Sum[branch^k,{k,0,level}],branch,
    FilterRules[{opts}, Options[KaryTree]],
    GraphLayout->"RadialEmbedding",
    PlotTheme->"LargeGraph"
]

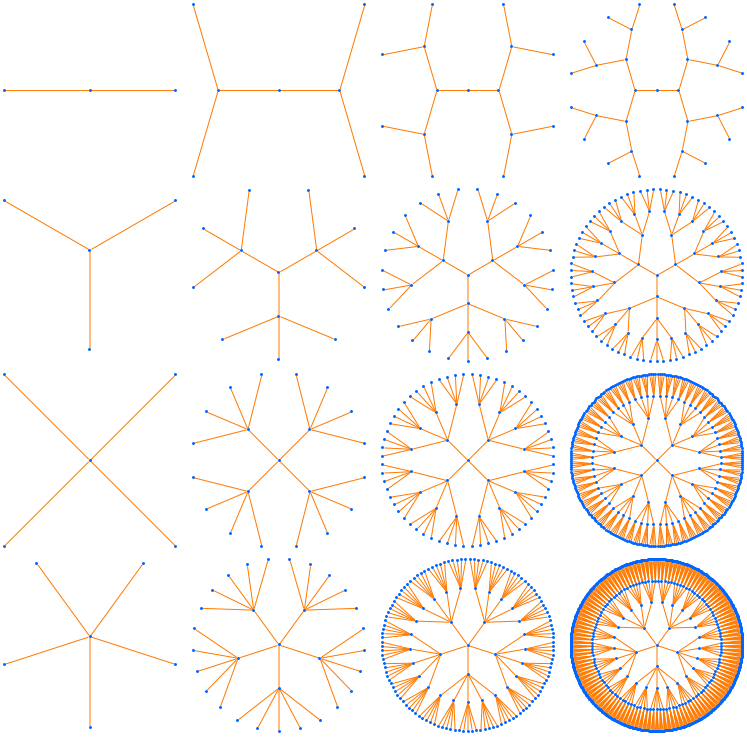
To understand how it works look up in docs every single function from this definition starting with KaryTree. Example with different branches and levels:

Grid[Table[diagramsJHA[b, l], {b, 2, 5}, {l, 4}]]

enter image description here

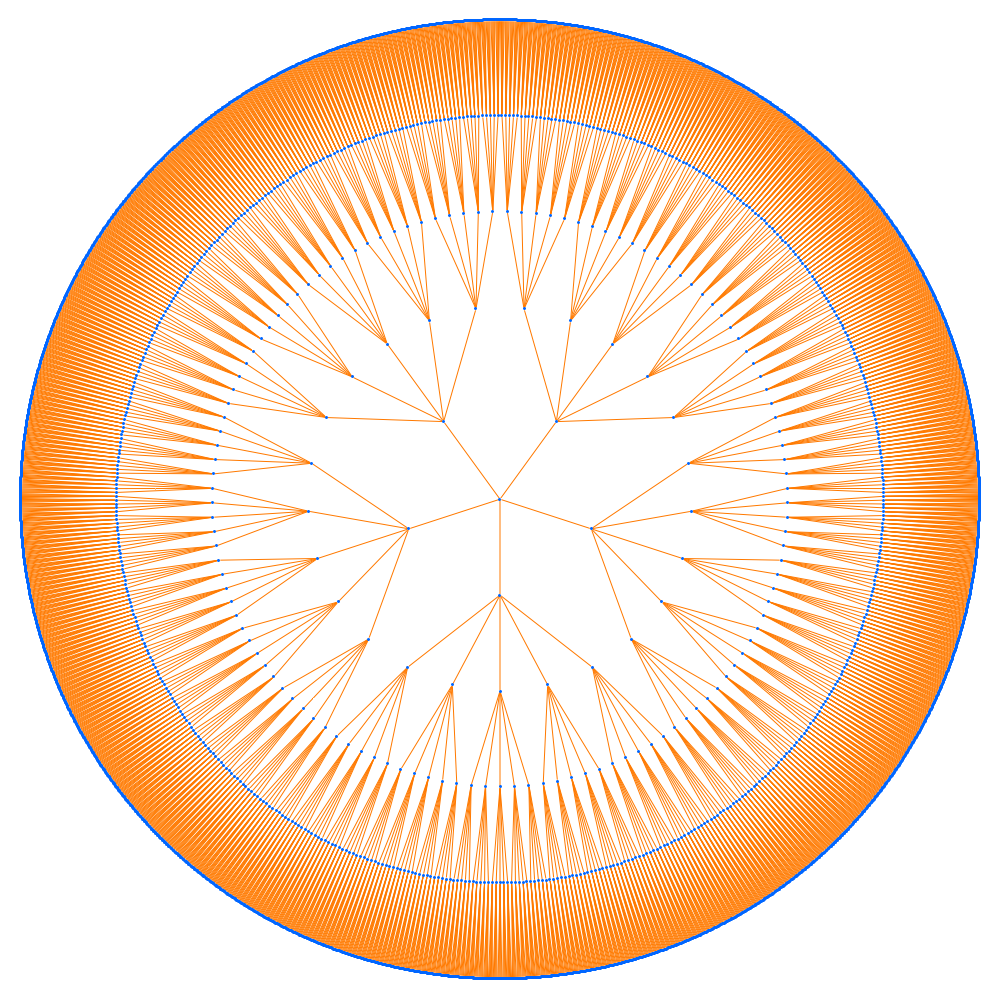
Example of a large diagram:

diagramsJHA[5, 5, ImageSize -> 1000]

enter image description here

POSTED BY: Vitaliy Kaurov
Reply to this discussion
Community posts can be styled and formatted using the Markdown syntax.
Reply Preview
Attachments
Remove
or Discard

Group Abstract Group Abstract