Message Boards Message Boards

Get RGBColor of rendered Graphics3D with specified lighting?

Posted 5 years ago

I am trying to find out if there are ways to access color data of an imported 3D graphics with a specified lighting or whether that data is not accessible by the user. So take the following code as example:

Show[Import["ExampleData/seashell.obj", "Graphics3D"], 
 PlotStyle -> Specularity[White, 0], 
 Lighting -> {{"Point", Red, Scaled[{-1, -1, 0}]}, {"Point", Blue, 
    Scaled[{0, -1, 0}]}, {"Point", Green, Scaled[{1, -1, 0}]}}, 
 Boxed -> True, Axes -> True]

which produces:

enter image description here

Neither in FullForm[] or anything else I have tried could I find how to access the rendered color per polygon/triangle of the rendered Graphics3D object. However computations are possible on the image itself, like ImageHistogram[]. Are there ways to do Color computations on the underlying polygons, e.g. get a list of the rendered RGB colors in the same order as Graphics3D polygons in its InputForm[]? The goal is not to change the rendering but rather use the rendered color values (no matter whether visible from a certain viewpoint or not) to do statistical calculations over the surface of the geometry. Any ideas how that data can be accessed?

POSTED BY: Fabian Wenger
11 Replies
Posted 5 years ago

Apart from rendering each triangle independently and doing image analysis on each bit… i would have no idea.

POSTED BY: Updating Name

Thanks for the suggestion but that would mean I would loose shadowing information of a triangle by the rest of the geometry which I would like to include in the computation.

POSTED BY: Fabian Wenger

Hi Fabian,

I do not have an idea about accessing color information of specific triangles - it is a good question!

The goal is not to change the rendering but rather use the rendered color values (no matter whether visible from a certain viewpoint or not) to do statistical calculations over the surface of the geometry.

Well, this probably can be done simpler - you just calculate the normal vector of each triangle:

gr = Import["ExampleData/seashell.obj", "Graphics3D"];
mesh = DiscretizeGraphics[gr];
triangs = MeshPrimitives[mesh, 2];
polyNormal = With[{c = RegionCentroid[#]}, Arrow[{c, c + .05 Normalize[Cross[#[[1, 2]] - #[[1, 1]], #[[1, 3]] - #[[1, 1]]]]}]] &;
Show[Graphics3D[{Arrowheads[.02], polyNormal /@ triangs}], gr]

enter image description here

And in this way you directly have access to the respective directions:

directs = Normalize[Cross[#[[1, 2]] - #[[1, 1]], #[[1, 3]] - #[[1, 1]]]] & /@ triangs;
Show[Graphics3D[Point[directs]], gr]

enter image description here

Does that help? Regards -- Henrik

POSTED BY: Henrik Schachner

Hi Henrik, thanks a lot, the color is a function of the surface normal and position given that none of the point light sources is shadowed by another surface element. Of course I could just loop through all other triangles for the one in question but it becomes time-consuming for a large mesh. Maybe that is my only choice or I need to learn a tool like "blender". It is just a little frustrating having the result in front of me in Wolfram Language and not being able to pipe the data into a table...

POSTED BY: Fabian Wenger

Mathematica does not do shadows though…

POSTED BY: Sander Huisman

Of course I could just loop through all other triangles for the one in question but it becomes time-consuming for a large mesh.

I am afraid I still have not understood your problem. If you are interested in the orientation of a single specific triangle ("the one in question"), you can easily calculate its orientation. If you need all orientations for doing statistics you can use a method like I demonstrated above. I do not know what you mean by "large mesh", but if I do some test:

gr = KnotData["SolomonSeal"];
AbsoluteTiming[
 mesh = DiscretizeGraphics[gr];
 triangs = MeshPrimitives[mesh, 2];
 directs = Normalize[Cross[#[[1, 2]] - #[[1, 1]], #[[1, 3]] - #[[1, 1]]]] & /@ triangs;
 Length[triangs]]
(* Out:   {1.79487, 21072} *)

then I get a result for a mesh consisting of 21072 triangles on my old PC in less then 2 seconds. Using Parallelization and Compilation this most likely can be quite a bit improved. (And in this example I find the result quite nice.)

Show[Graphics3D[{Point[directs]}], gr]

enter image description here

POSTED BY: Henrik Schachner

I am sorry if I have been unclear but given a couple of point light sources AND a viewpoint for observation each triangle of the object has a certain color in the projection towards the viewpoint. So it is not a function of the surface normal alone but of incoming/outgoing rays between source/viewpoint. In addition certain triangles are visible or while others are not. Both these qualities are present in the rendered image and would be of interest to me.

So it seems the only way is really to work with the rendered image and identify pixel colors with corresponding nearest triangle of the object as "Updating Name" has suggested.

POSTED BY: Fabian Wenger

It's not that bad while indeed cast shadows of other objects are absent, the flip side of a point illuminated object is really pitch black as you can see by viewing it from several angles:

Show[{Import["ExampleData/seashell.obj", "Graphics3D"]}, 
   PlotStyle -> Specularity[0], 
   Lighting -> {{"Point", Red, {-1, -1, 0}}, {"Point", 
      Blue, {0, -1, 0}}, {"Point", Green, {1, -1, 0}}}, Boxed -> True,
    Axes -> True, ViewPoint -> #] & /@ {Front, Back, Top} 

enter image description here

POSTED BY: Fabian Wenger

While I still prefer to find a way to solve this within the Wolfram language there are plenty of renderers where you can fiddle with the source code to get the RGB of the incoming rays to a certain projection direction. An example is pbrt-v3

enter image description here

A big plus for pbrt is a nice online documentation and an online book

POSTED BY: Fabian Wenger

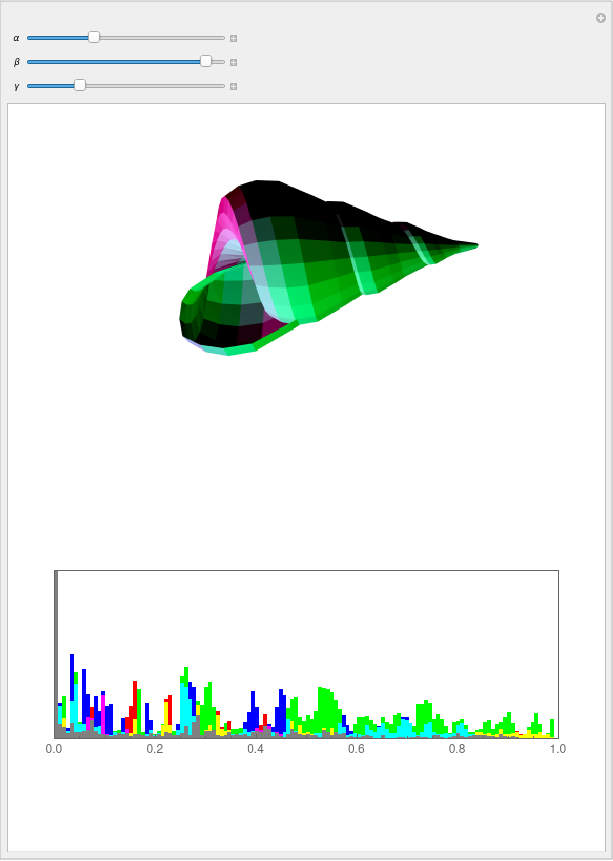
A rotation relative to the illumination, and then a statistics on the colors seen from a specific view point - is it this you need?

gr0 = Import["ExampleData/seashell.obj", "Graphics3D"];

Manipulate[
 GraphicsColumn[{img = 
    Rasterize@
       Graphics3D[
        GeometricTransformation[#, 
         EulerMatrix[{\[Alpha], \[Beta], \[Gamma]}]], 
        Lighting -> {{"Point", Red, Scaled[{-1, -1, 0}]}, {"Point", 
           Blue, Scaled[{0, -1, 0}]}, {"Point", Green, 
           Scaled[{1, -1, 0}]}}, Boxed -> False, Axes -> False] & @@ gr0, ImageHistogram@RemoveBackground[img, White]}, 
  ImageSize -> Large], {\[Alpha], 0, 2 Pi}, {\[Beta], 0, 
  2 Pi}, {\[Gamma], 0, 2 Pi}]

enter image description here

POSTED BY: Henrik Schachner

Hi Henrik, I would still need to make the correspondence of a certain pixel in the image to the triangle(s) it is mapped to on the mesh. That would solve it indeed.

POSTED BY: Fabian Wenger
Reply to this discussion
Community posts can be styled and formatted using the Markdown syntax.
Reply Preview
Attachments
Remove
or Discard

Group Abstract Group Abstract