Message Boards Message Boards

3
|
28928 Views
|
3 Replies
|
14 Total Likes
View groups...
Share
Share this post:

Plot the Intersection of Two Surfaces

Posted 11 years ago
I would like to know how it can be possible,in Wolfram, to plot an explicit graph of intersection of two surfaces. For instance:
13x^2+40y^2+4z^2+28xy-8xz-8yz-x+y+z+1

and
x-y+z

Thank you very much!
POSTED BY: teo ytriu
3 Replies
Building on Michael Rogers version ( also see this tutorial ) we get:
h = 13 x^2 + 8 y^2 + 4 z^2 + 2 x y - 8 x z - 8 y z - x + y + z - 1;
g = x - y + z;

ContourPlot3D[{h == 0, g == 0}, {x, -1, 1}, {y, -1, 1}, {z, -1, 1},
MeshFunctions -> {Function[{x, y, z, f}, h - g]}, MeshStyle -> {{Thick, Blue}}, Mesh -> {{0}},
ContourStyle -> Directive[Orange, Opacity[0.5], Specularity[White, 30]],
PlotPoints -> 60, SphericalRegion -> True]

POSTED BY: Vitaliy Kaurov
Reduce[13 x^2 + 40 y^2 + 4 z^2 + 28 x y - 8 x z - 8 y z - x + y + z +
   1 == 0, {x, y, z}, Reals]
False
POSTED BY: Frank Kampas
If by surfaces you mean where each formula is zero, then it turns out that 13x^2+40y^2+4z^2+28xy-8xz-8yz-x+y+z+1 = 0 has no real solutions.  Substituting another formula, here is a way.

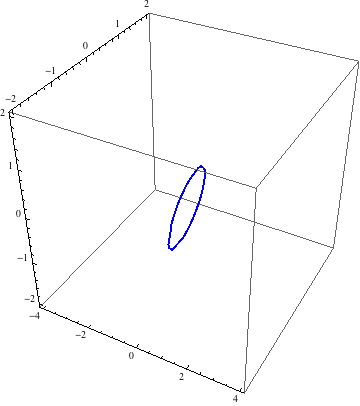
ContourPlot3D[{13 x^2 + 8 y^2 + 4 z^2 + 2 x y - 8 x z - 8 y z - x +
   y + z - 1, x - y + z}, {x, -4, 4}, {y, -2, 2}, {z, -2, 2},
Contours -> {0}, ContourStyle -> None, Mesh -> None,
BoundaryStyle -> {1 -> None, 2 -> None, {1, 2} -> {{Thick, Blue}}}]


POSTED BY: Michael Rogers
Reply to this discussion
Community posts can be styled and formatted using the Markdown syntax.
Reply Preview
Attachments
Remove
or Discard

Group Abstract Group Abstract