Introduction
The National Institute for Space Research (INPE) has recorded more than 74,000 fires so far this year an 84 per cent increase on the same period in 2018. This is the highest number since records began in 2013.
The Amazon is regarded as vital in the fight against global warming due to its ability to absorb carbon from the air. It's often referred to as the "lungs of the Earth," as more than 20 per cent of the world's oxygen is produced there. Brazil has the biggest share of the 670 million hectares of forest (60 per cent), which is home to more species than anywhere else on the planet. But unlike in other ecosystems, scientists say that most wildfires burning in the Amazon are not natural. Deforestation is considered the major contributing factor behind the alarming numbers. Environmentalists have also put the blame on President Jair Bolsonaro, saying his policies have only threatened the forest more. Bolsonaro has suggested that the data showing the increase in wildfires isn't accurate, even going as far as to blame NGOs without evidence for starting fires. He said his government is working to control the fires, but it's not clear what measures the administration is taking. While drought can be a factor in rainforest fires, INPE researchers have said there is nothing abnormal about the climate or rainfall amounts in the Amazon this year. Human activities (farming, mining and drilling) are what scientists say are worsening the situation now. In Brazil, cattle farmers start fires deliberately to clear forest to make way for ranching, and it's not always legal.
Visualizing the data
In order to analyze the data from INPE, lets first visualize the states of Brazil along their population density.
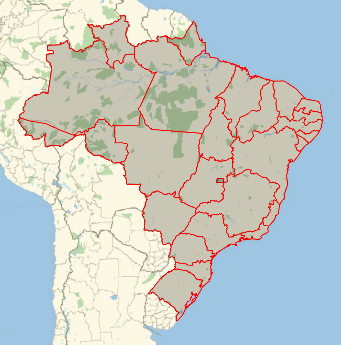
State divisions of Brazil:
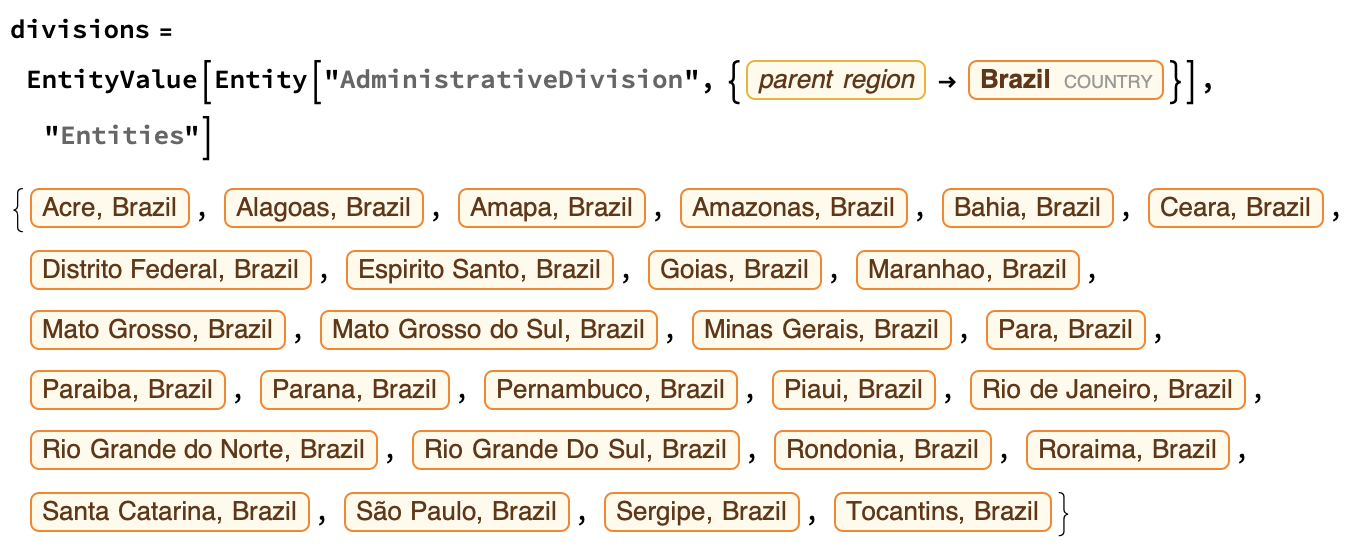
We can now display the divisions on a map:
GeoGraphics[{EdgeForm[Red], Opacity[0.1], Polygon[divisions]}]
Population density in Brazil:
With the help of EntityValue we can retrieve the population of each state and then color them according to its population:
dat = EntityValue[Reverse@divisions, {"Name", "Population", "Polygon"}];

rng = Through[{Min, Max}@QuantityMagnitude[dat[[All, 2]]]];

Labeled[ GeoGraphics[ {GeoStyling[None], EdgeForm@GrayLevel[0, 0.5],
          Tooltip[{ColorData["AvocadoColors"]@Rescale[QuantityMagnitude[#2], rng], #3},
         Column[{Style[#1, Bold], #2}]] & @@@ dat}],
 BarLegend[{"AvocadoColors", rng}, 8], Right]
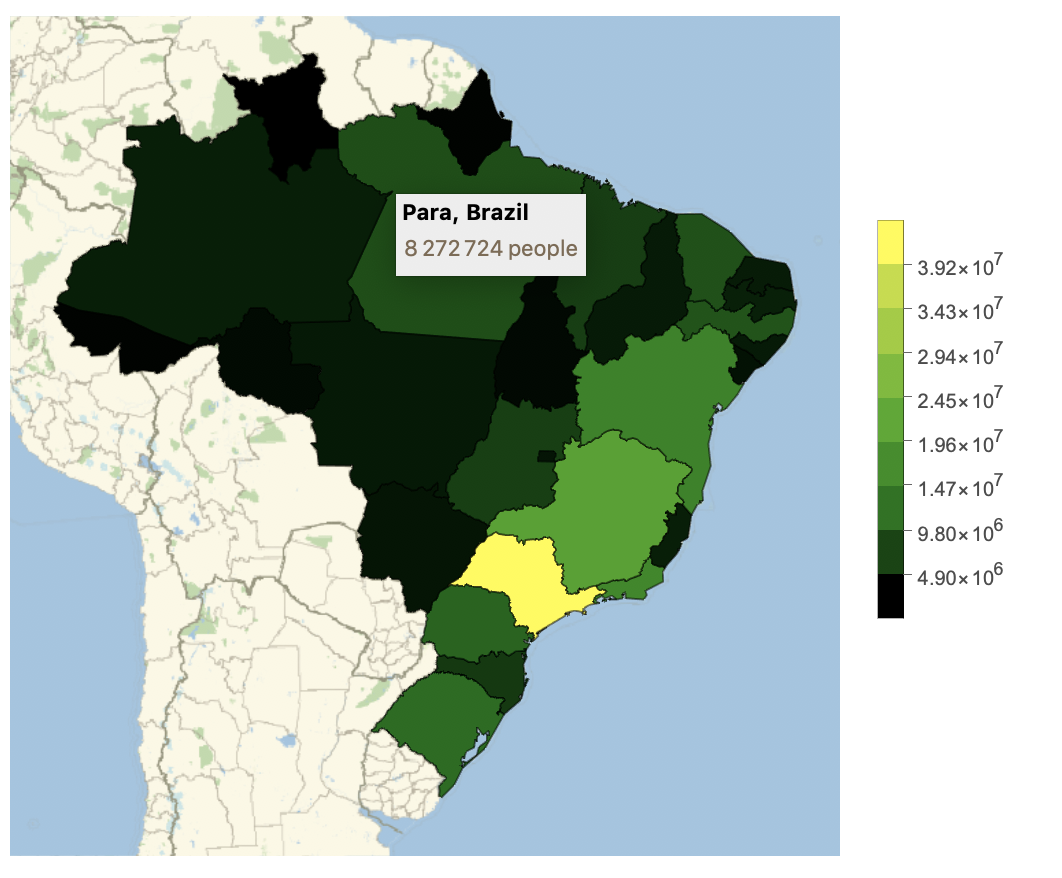
We can see that the state of Amazonas (left-upper corner) has a low population density (dark green), but the extension of the amazon rainforest spreads over several neighbouring states, like Mato Grosso and Para, which are alarmingly increasing their number of fires due to human activities: farming, mining and drilling.
Parsing fires data from INPE
The National Institute for Space Research (INPE) has recorded the number of forest fires in Brazil (by state) during the last 7 years. We can import the data in TSV format directly from their site:
rawData =
  "AC\t700\t10%\t775\t4%\t806\t134%\t1.890\t-58%\t791\t7%\t851\t197%\t2.533
  AL\t128\t-9%\t116\t69%\t196\t-60%\t78\t5%\t82\t-25%\t61\t19%\t73
  AM\t1.494\t99%\t2.977\t21%\t3.616\t26%\t4.577\t8%\t4.948\t-42%\t2.870\t151%\t7.225
  AP\t27\t77%\t48\t-8%\t44\t-13%\t38\t-55%\t17\t111%\t36\t-52%\t17
  BA\t2.133\t-28%\t1.528\t11%\t1.703\t45%\t2.475\t-38%\t1.516\t-22%\t1.177\t90%\t2.245
  CE\t274\t4%\t285\t22%\t348\t29%\t450\t-56%\t194\t65%\t321\t-4%\t306
  DF\t52\t134%\t122\t-60%\t48\t231%\t159\t-30%\t110\t-64%\t39\t51%\t59
  ES\t179\t-35%\t115\t119%\t252\t44%\t365\t-76%\t87\t1%\t88\t160%\t229
  GO\t1.338\t41%\t1.892\t-19%\t1.520\t57%\t2.393\t-25%\t1.792\t-24%\t1.346\t22%\t1.653
  MA\t4.003\t81%\t7.247\t7%\t7.822\t-16%\t6.506\t-31%\t4.460\t-11%\t3.951\t23%\t4.880
  MG\t1.933\t24%\t2.414\t-37%\t1.509\t90%\t2.873\t-31%\t1.971\t-20%\t1.564\t75%\t2.739
  MS\t1.322\t-27%\t954\t109%\t1.999\t7%\t2.153\t9%\t2.367\t-54%\t1.071\t278%\t4.056
  MT\t7.631\t34%\t10.267\t-15%\t8.695\t50%\t13.078\t-33%\t8.662\t-14%\t7.408\t91%\t14.157
  PA\t3.092\t170%\t8.349\t-4%\t7.967\t-3%\t7.709\t24%\t9.590\t-65%\t3.330\t198%\t9.952
  PB\t71\t67%\t119\t-34%\t78\t-6%\t73\t-45%\t40\t60%\t64\t20%\t77
  PE\t173\t-5%\t164\t48%\t244\t-63%\t90\t36%\t123\t-22%\t95\t36%\t130
  PI\t1.440\t123%\t3.223\t-19%\t2.599\t-7%\t2.416\t-34%\t1.581\t85%\t2.933\t-25%\t2.176
  PR\t1.298\t-23%\t992\t20%\t1.196\t44%\t1.724\t-10%\t1.540\t-1%\t1.511\t12%\t1.697
  RJ\t173\t101%\t348\t-1%\t343\t0%\t346\t-30%\t241\t-41%\t140\t182%\t396
  RN\t69\t-17%\t57\t36%\t78\t-28%\t56\t23%\t69\t21%\t84\t-31%\t58
  RO\t693\t210%\t2.151\t46%\t3.156\t-2%\t3.073\t-12%\t2.700\t-29%\t1.908\t203%\t5.787
  RR\t950\t84%\t1.757\t-14%\t1.499\t136%\t3.541\t-82%\t616\t221%\t1.981\t132%\t4.608
  RS\t890\t33%\t1.192\t-25%\t894\t150%\t2.242\t-37%\t1.399\t-27%\t1.009\t80%\t1.817
  SC\t958\t-49%\t481\t32%\t635\t112%\t1.352\t-23%\t1.034\t-15%\t873\t13%\t988
  SE\t155\t-56%\t68\t122%\t151\t-53%\t70\t-2%\t68\t8%\t74\t-16%\t62
  SP\t1.274\t46%\t1.872\t-42%\t1.078\t104%\t2.208\t-29%\t1.565\t38%\t2.172\t-30%\t1.516
  TO\t4.095\t36%\t5.578\t-12%\t4.909\t50%\t7.375\t-32%\t4.995\t-23%\t3.829\t54%\t5.900
  ";
Now we need to obtain the administrative divisions and their corresponding abbreviations:
divisionsRaw = Import["https://en.wikipedia.org/wiki/Subdivisions_of_Brazil", "Text"];

{abbreviations, states} =
 Transpose@
  StringCases[
   Last@StringSplit[divisionsRaw, "<table class=\"multicol"],
   "</span><a href=\"/wiki/" ~~ Shortest[__] ~~ "\">" ~~
     Shortest[state__] ~~ "</a> (" ~~ Shortest[abbreviation__] ~~
     ")</li>" :> {abbreviation , state}]
 {{"AC", "AL", "AP", "AM", "BA", "CE", "ES", "GO", "MA", "MT", "MS",
 "MG", "PA", "PB", "PR", "PE", "PI", "RJ", "RN", "RS", "RO", "RR",
 "SC", "SP", "SE", "TO", "DF"}, {"Acre", "Alagoas", "Amapá",
 "Amazonas", "Bahia", "Ceará", "Espírito Santo", "Goiás", "Maranhão",
 "Mato Grosso", "Mato Grosso do Sul", "Minas Gerais", "Pará",
 "Paraíba", "Paraná", "Pernambuco", "Piauí", "Rio de Janeiro", "Rio Grande do Norte",
 "Rio Grande do Sul", "Rondônia", "Roraima",
 "Santa Catarina", "São Paulo", "Sergipe", "Tocantins", "Distrito Federal"}}
data = Map[
  If[StringContainsQ[#, __ ~~ "%"], Nothing,
    ToExpression@StringDelete[#, "."]] &,
  StringSplit[StringSplit[rawData, "\n"], "\t"], {2}]
We can get corresponding state entities using Interpreter:
statesEntities =
 Interpreter[
   Restricted[
    "AdministrativeDivision", {EntityProperty[
       "AdministrativeDivision", "ParentRegion"] ->
      Entity["Country", "Brazil"]}]][
  Map[StringJoin[#, ", Brazil"] &, states]]
Now we can easily get the fires during the last years per each state:
firesPerYear =
 Map[First[#] -> Rest[#] &,
  data /. Rule @@@ Transpose@{abbreviations, statesEntities}]
{AC -> {700, 775, 806, 1890, 791, 851, 2533}, AL -> {128, 116, 196, 78, 82, 61, 73}, AM -> {1494, 2977, 3616, 4577, 4948, 2870, 7225},
AP -> {27, 48, 44, 38, 17, 36, 17}, BA -> {2133, 1528, 1703, 2475, 1516, 1177, 2245}, CE -> {274, 285, 348, 450, 194, 321, 306}, DF -> {52, 122, 48, 159, 110, 39, 59}, ES -> {179, 115, 252, 365, 87, 88, 229}, GO -> {1338, 1892, 1520, 2393, 1792, 1346, 1653}, MA -> {4003, 7247, 7822, 6506, 4460, 3951, 4880}, MG -> {1933, 2414, 1509, 2873, 1971, 1564, 2739}, MS -> {1322, 954, 1999, 2153, 2367, 1071, 4056}, MT -> {7631, 10267, 8695, 13078, 8662, 7408, 14157}, PA -> {3092, 8349, 7967, 7709, 9590, 3330, 9952}, PB -> {71, 119, 78, 73, 40, 64, 77}, PE -> {173, 164, 244, 90, 123, 95, 130}, PI -> {1440, 3223, 2599, 2416, 1581, 2933, 2176}, PR -> {1298, 992, 1196, 1724, 1540, 1511, 1697}, RJ -> {173, 348, 343, 346, 241, 140, 396}, RN -> {69, 57, 78, 56, 69, 84, 58}, RO -> {693, 2151, 3156, 3073, 2700, 1908, 5787}, RR -> {950, 1757, 1499, 3541, 616, 1981, 4608}, RS -> {890, 1192, 894, 2242, 1399, 1009, 1817}, SC -> {958, 481, 635, 1352, 1034, 873, 988}, SE -> {155, 68, 151, 70, 68, 74, 62}, SP -> {1274, 1872, 1078, 2208, 1565, 2172, 1516}, TO -> {4095, 5578, 4909, 7375, 4995, 3829, 5900}}
Creating the final GIF animation:
Finally we will generate several points for each state using RandomGeoPosition that will represent the number of fires (~25 fires per red dot):
frames = Table[
   ImagePad[
    Rasterize[
     Labeled[GeoGraphics[
       Join[{Red},
        MapThread[
         Point@RandomGeoPosition[#1,
            Round[#2[[i]]/25]] &, {statesEntities,
          Values@firesPerYear}], {EdgeForm[Darker[Green]], Green,
         Opacity[0.1], Polygon[statesEntities]}],
       GeoBackground -> "Satellite",
       ImageSize ->
        Large], {Row[{Style[
          Evaluate["Forest Fires in " ~~ ToString[2012 + i]],
          FontFamily -> "Helvetica", Bold, 26],
         Style["  (1 red dot \[TildeTilde] 25 fires)
          ", FontFamily -> "Helvetica", 22]}],
       Column[{Style["created by @jofre_ep using:",
          FontFamily -> "Helvetica", 14], logo}]}, {Top, Bottom}],
     RasterSize -> Large, ImageSize -> Large], 20,
    Padding -> White], {i, 1, 7}];

SetDirectory[NotebookDirectory[]];

Export["Fires_Brazil.gif", frames, "DisplayDurations" -> 1,
 "AnimationRepetitions" -> Infinity]
Final Conclusions
In Mato Grosso and Para, where Brazil's agricultural frontier has expanded and pushed into the forest basin, more deforestation has been recorded and wildfires have increased.
The World Wildlife Fund estimates that more than a quarter of the Amazon will be without trees by 2030 if the current rate of deforestation continues.
The fears surrounding deforestation have grown under Bolsonaro, who has vowed to develop the region for farming and mining since coming into office, ignoring international concern over deforestation and climate change.
Data from INPE suggests that since he took power in January, deforestation numbers have soared.
See some interesting discussions and references on the topic:
https://theintercept.com/2019/07/06/brazil-amazon-rainforest-indigenous-conservation-agribusiness-ranching/ https://www.economist.com/leaders/2019/08/01/deathwatch-for-the-amazon https://agupubs.onlinelibrary.wiley.com/doi/full/10.1029/2010JD015174 https://www.theguardian.com/world/2019/jul/25/amazonian-rainforest-near-unrecoverable-tipping-point https://www.bbc.com/news/world-latin-america-49212115 https://globalnews.ca/news/5794191/amazon-rainforest-fire-explained/ https://www.youtube.com/watch?v=zhESYHHbzsc
Future analysis:
Visualizing the average temperatures changes over the last 7 years. I read that this years climate in Brazil hasn't been much different to previous years. And this is the main argument to conclude that the increase in number of fires is due to human activities.
Close look/analysis on protected areas of amazon rainforest (most of them located in Amazonas state).
- Comparison with other countries with amazon rainforest, like Peru, Bolivia and Colombia.
Let me know your opinion and feel free share your own data analysis/visualisations on this thread.


