Introduction:
One problem in chemistry is finding all possible molecules, as there are rotations and reflections. All the possibilities of existence of halomethanes (even unstable ones) are addressed here. This is a question similar to the sequence: Doubly triangular numbers (A002817OEIS, N. J. A. Sloane, Apr 18, 2017): Number of inequivalent ways to color vertices of a square using <= n colors, allowing rotations and reflections ... , a(n)=n(n+1)(n^ 2+n+2)/8.
However as described in the sequence A002817OEIS, only the total result of the possibilities is addressed, while here in this post I visually demonstrate all possibilities, both in list, 2D and 3D graphs and mass list.
Function Code:
With this function below it is possible to find and visualize all possibilities of halomethanes, taking into account all rotations and reflections of the molecules. I developed this function with some options (Mode) besides the list of terms. Examples of options: "Color", "Visual", "Visual3D", "Mass".
Here the function demonstration is done with all halogens (except radioactive halogens, by choice), but any of the possible elements can be used as an argument in the function. Example: {"H"}, {"F", "Br", "I"}, {...} ... {"H", "F", "Cl", "Br", "I" }.
Halomethanes[elem_, OptionsPattern[]] :=
 Module[{eleu, z, cc, a, a1, f, rP, ap, n, b}, z = Length@elem;
  Options[Halomethanes] = {"Mode" -> "Table"}; eleu = elem[[1]];
  a = Tuples[elem, 4] /. {"Cl" -> "D", "Br" -> "B"}; n[x_] := {x};
  cc = {"C" -> GrayLevel[0.5], "F" -> RGBColor[1, 0.5, 0.5],
    "Cl" -> RGBColor[0, 0.56, 0], "Br" -> RGBColor[0.6, 0.4, 0.2],
    "I" -> RGBColor[1, 0, 0], "H" -> RGBColor[0, 1, 1]}; a1 = a[[1]];
  f[a_] := Module[{bt, ct, dt, e1, e2, ft, gt, r1},
    bt = Table[StringJoin[a[[b]]], {b, 1, Length@a}];
    ct = Table[StringJoin@Table[a[[c]], 2], {c, 1, Length@a}];
    dt = Table[
      StringJoin[a[[d]][[4]], a[[d]][[3]], a[[d]][[2]],
       a[[d]][[1]]], {d, 1, Length@a}];
    e1 = Table[
      StringCases[ct[[i]], RegularExpression[bt[[1]]]], {i, 1,
       Length@ct}];
    e2 = Table[
      StringCases[ct[[i]], RegularExpression[dt[[1]]]], {i, 1,
       Length@ct}];
    ft = Table[{Length@(e1[[j]]),
        Length@(e2[[j]])} /. {{2, 2} -> bt[[j]], {2, 0} ->
         bt[[j]], {0, 2} -> {"copy"}, {0, 0} -> bt[[j]], {2, 1} ->
         bt[[j]], {1, 2} -> {"copy"}, {1, 0} -> {"copy"}, {0,
          1} -> {"copy"}, {1, 1} -> {"copy"}}, {j, 1, Length@ct}];
    gt = Table[
      StringPartition[DeleteCases[ft, {"copy"}][[o]], 1], {o, 1,
       Length@DeleteCases[ft, {"copy"}]}];
    r1 = If[gt != {}, If[gt[[1]] == a[[1]], gt[[1]], {}], {}]; {rP =
      DeleteCases[r1, {}],
     ap = If[r1 != {}, DeleteCases[gt, r1], gt]}];
  Do[b = AppendTo[n[a1], {a = f[a][[2]], f[a][[1]]}[[2]]],
   z*(z + 1)*(z^2 + z + 2)/8 - 1];
  OptionValue[
    "Mode"] /. {"Table" ->
     If[z == 1, {{eleu, eleu, eleu, eleu}},
      b /. {"D" -> "Cl", "B" -> "Br"}],
    "Color" -> {TableForm[{{"H",
         Text[Style["Cyan", RGBColor[0, 1, 1], Medium]]}, {"F",
         Text[Style["Pink", RGBColor[1, 0.5, 0.5], Medium]]}, {"Cl",
         Text[Style["Green", RGBColor[0, 0.56, 0], Medium]]}, {"Br",
         Text[Style["Brown", RGBColor[0.6, 0.4, 0.2], Medium]]}, {"I",
          Text[Style["Red", RGBColor[1, 0, 0], Medium]]}},
       TableHeadings -> {None, {"Atom", "Color"}}],
      If[z == 1, {Flatten@Table[elem, 4]},
        b /. {"D" -> "Cl", "B" -> "Br"}] /. cc},
    "Visual" ->
     If[z == 1,
      MoleculePlot[
       Molecule[{"C", eleu, eleu, eleu, eleu}, {Bond[{1, 2}],
         Bond[{1, 3}], Bond[{1, 4}], Bond[{1, 5}]}], ColorRules -> cc,
        ImageSize -> 100],
      Table[MoleculePlot[
        Molecule[
         Join[{"C"}, (b /. {"D" -> "Cl", "B" -> "Br"})[[
           h]]], {Bond[{1, 2}], Bond[{1, 3}], Bond[{1, 4}],
          Bond[{1, 5}]}], ColorRules -> cc, ImageSize -> 100], {h, 1,
        Length@b}]],
    "Visual3D" ->
     If[z == 1,
      MoleculePlot3D[
       Molecule[{"C", eleu, eleu, eleu, eleu}, {Bond[{1, 2}],
         Bond[{1, 3}], Bond[{1, 4}], Bond[{1, 5}]}], ColorRules -> cc,
        ImageSize -> 100],
      Table[MoleculePlot3D[
        Molecule[
         Join[{"C"}, (b /. {"D" -> "Cl", "B" -> "Br"})[[
           h]]], {Bond[{1, 2}], Bond[{1, 3}], Bond[{1, 4}],
          Bond[{1, 5}]}], ColorRules -> cc, ImageSize -> 80], {h, 1,
        Length@b}]],
    "Mass" ->
     If[z == 1,
      MoleculeValue[
       Molecule[{"C", eleu, eleu, eleu, eleu}, {Bond[{1, 2}],
         Bond[{1, 3}], Bond[{1, 4}], Bond[{1, 5}]}], "MolecularMass"],
       Table[MoleculeValue[
        Molecule[
         Join[{"C"}, (b /. {"D" -> "Cl", "B" -> "Br"})[[
           h]]], {Bond[{1, 2}], Bond[{1, 3}], Bond[{1, 4}],
          Bond[{1, 5}]}], "MolecularMass"], {h, 1, Length@b}]]}]
Visualization:
In the simplest form, with only one argument, a list of all halomethane molecules is generated.
rp = Halomethanes[{"H", "F", "Cl", "Br", "I"}]

Length@rp
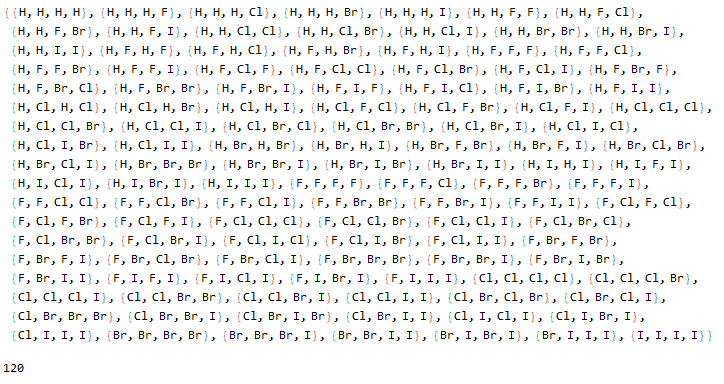
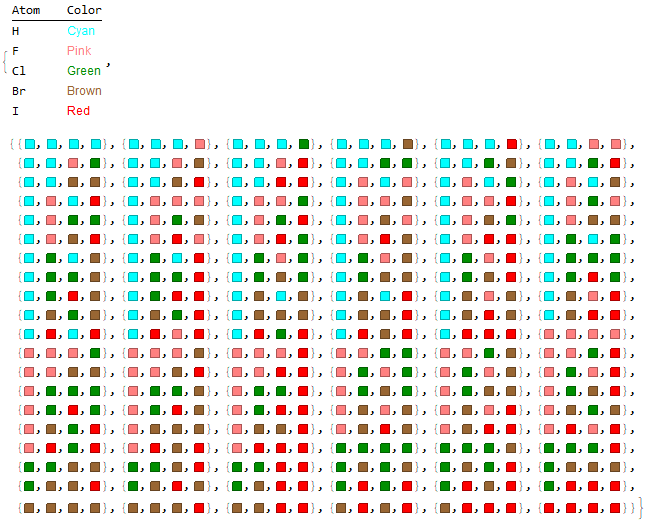
Optionally, a list of molecules with their respective illustrative colors is generated with the "Mode" -> "Color" option.
Halomethanes[{"H", "F", "Cl", "Br", "I"}, "Mode" -> "Color"]
Optionally, a list of molecules with 2D structural representations is generated with the "Mode" -> "Visual" option (the 2D model can better represent stereoisomerism than the 3D model).
Halomethanes[{"H", "F", "Cl", "Br", "I"}, "Mode" -> "Visual"]

- 3D VISUAL TABLE (interactive):
Optionally, a list of molecules with 3D structural representations is generated with the "Mode" -> "Visual3D" option. This list is interactive, and each molecule can be rotated for better viewing (stereoisomerism is not very well represented in these 3D models as the representations are tetrahedral, for example, the isomers {"H","F","H","F"} and {"F","F","H,H} are very similar in this view).
Halomethanes[{"H", "F", "Cl", "Br", "I"}, "Mode" -> "Visual3D"]
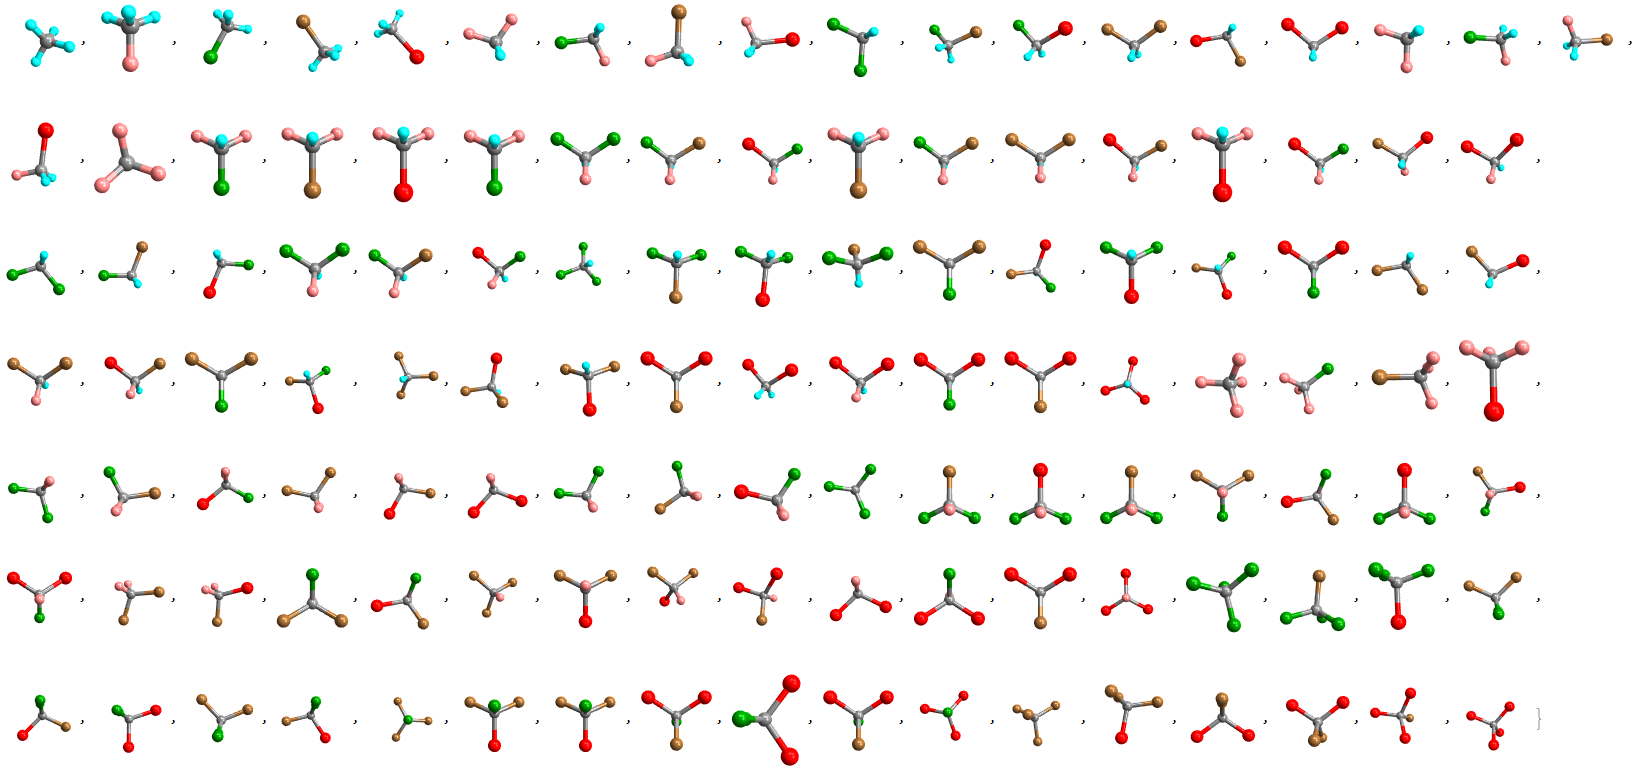
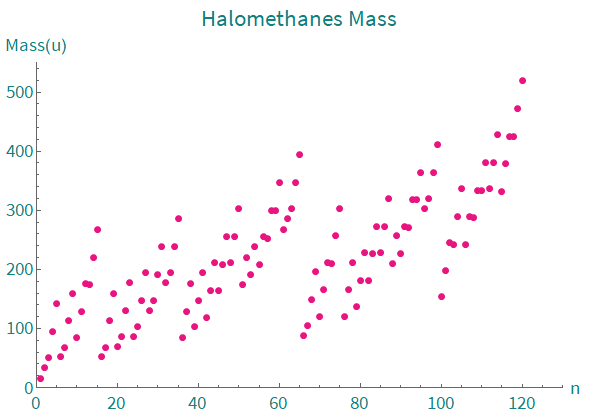
Finally, a list of the masses of all halomethanes can be generated with the argument "Mode" -> "Mass" (some of them, although unstable, are mentioned in the list).
resp2 = Halomethanes[{"H", "F", "Cl", "Br", "I"}, "Mode" -> "Mass"]
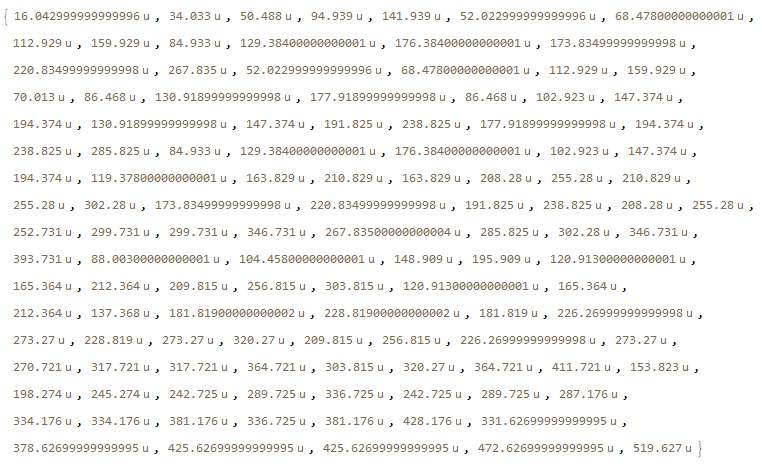
Illustrative graph of the mass distributions of all possible halomethanes:
ListPlot[resp2, AxesLabel -> {"n", "Mass(u)"},
 LabelStyle -> Directive["Subsubsection", RGBColor[0.07, 0.5, 0.5]],
 PlotLabel -> "Halomethanes Mass", PlotRange -> {{0, 130}, {0, 550}},
 PlotStyle -> Directive[RGBColor[0.91, 0.08, 0.5], PointSize[Large]],
 ImageSize -> Large]
Link: (Doubly triangular numbers, A002817OEIS, sequence):
https://oeis.org/A002817
Thanks.