This question is also asked here.
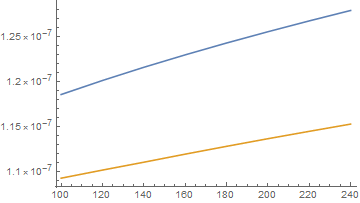
I would like to reproduce the two solid curves in Fig. 1a of this paper. The total energy is given in Appendix A of the paper, and the curve is obtained by minimizing the energy with respect to the variational parameters $\sigma_k$ and $d$. I'm not sure what dimensionless variables they used on the code, but I'll expresses the energy using $(x,y,z)=(\sigma_x,\sigma_y,\sigma_z)/\bar{a}$; $(wx,wy,wz)=(\omega_x,\omega_y,\omega_z)/\bar{\omega}$; $as=a_s/\bar{a}$ and so on. (Notice that $\bar{a}$ has length dimension and $\bar{\omega}$ has the dimension inverse time).
ClearAll["Global`*"]

Idip[X_?NumericQ, Y_?NumericQ, u_?NumericQ] := Re[Exp[-u^2/2] -
3 X*Y/(1 - X^2)^(3/2) NIntegrate[v^2 Exp[-u^2 X^2 v^2/(2 (1 - X^2) (1 - v^2))]/(Sqrt[1 - v^2] Sqrt[1 - v^2 (1 - Y^2)/(1 - X^2)]), {v, 0,
Sqrt[1 - X^2]}]];

f[X_?NumericQ, Y_?NumericQ] := Re[Idip[X, Y, 0]];

Iqf[u_?NumericQ] := Re[2 Exp[-5 u^2/8]/Sqrt[Pi] NIntegrate[
Exp[-l^2] Cosh[Sqrt[2/5] u*l]^(5/2), {l, 0, Infinity}]];

ettot[x_, y_, z_, u_, wy_] := h*w[wy]/Kb (1/4 (1/x^2 + 1/y^2 + 1/z^2) +
1/4 (wx[wy]^2 x^2 (1 + u^2/2) + wy^2 y^2 + wz[wy]^2 z^2) +
as[wy]*n/(2 Sqrt[2 Pi] (x*y*z)) (1 + Exp[-u^2/2]) +
add[wy]*n/(2 Sqrt[2 Pi] (x*y*z)) (-f[x/z, y/z] -
Idip[x/z, y/z, u]) + 512*Sqrt[2] as[wy]^(5/2) n^(3/2)/(75 Sqrt[5] Pi^(7/4) (x*y*z)^(3/2)) (1 +
3 add[wy]^2/as[wy]^2) Iqf[u]);
Obs: In the code, wx and wz are dimensionless, but wy has the dimension inverse time. Morover, since they have used Kelvin units, I divided the total energy by Kb.
In order to find the local minima I have used the following code based on the one found here:
a0 = 5.29*10^(-11); (* Bohr radius *)
h = 1.054*10^(-34); (* Reduced Planck's constant *)
M = 163.9*1.66*10^(-27); (* Dy-164 mass in kg *)
wxx = 2 Pi*70; (* Experimental value of x-frequency *)
wzz = 2 Pi*1000; (* Experimental value of z-frequency *)
w[wy_] := (wxx*wy*wzz)^(1/3);
a[wy_] := Sqrt[h/(M*w[wy])];
wx[wy_] := wxx/w[wy]; (* Dimensionless x-frenquency*)
wz[wy_] := wzz/w[wy]; (* Dimensionless w-frenquency*)
add[wy_] := 131*a0/a[wy]; (* Dimensionless Dipolar length*)
as[wy_] := 70*a0/a[wy]; (* Dimensionless contact length*)
n = 10^4;
Kb = 1.38*10^(-23); (* Boltzmann constant *)

ddata1 = Table[minsol1 =FindMinimum[{ettot[x, y, z, 0, wy/w[wy]],
x > 0 && y > 0 && z > 0}, {{x, 1.01}, {y, 1.012}, {z, 0.14}},
Method -> Automatic, PrecisionGoal -> Automatic,
AccuracyGoal -> Automatic];
Re[{x, y, z, wy/(2 Pi) , minsol1[[1]]} /. Last[minsol1]], {wy,
2 Pi*100, 2 Pi*250, 2 Pi*20}];

ddata2 = Table[minsol2 =FindMinimum[{ettot[x, y, z, d/x, wy/w[wy]],
x > 0 && y > 0 && z > 0 && d > x}, {{x, 1.01}, {y, 1.012}, {z,
0.14}, {d, 1.02}}, Method -> Automatic,
PrecisionGoal -> Automatic, AccuracyGoal -> Automatic];
Re[{x, y, z, d, wy/(2 Pi) , minsol2[[1]]} /. Last[minsol2]], {wy,
2 Pi*100, 2 Pi*250, 2 Pi*20}];

ListPlot[{ddata1[[All, {4, 5}]], ddata2[[All, {5, 6}]]},
Joined -> True, PlotRange -> {Automatic, Automatic}]
I get two pretty nice curves using this code. However, I expected the curves to match at fy = 250. Moreover, at fy < 200 it had to be negative. Could helpe me?