Its a system of nonlinear differential equations. I would really appreciate the help.
Thank you.
Ok thank you for your time.
Sure, no problem.
Beyond that, might also look here:
https://mathematica.stackexchange.com/questions/14160/plotting-a-phase-portrait?noredirect=1&lq=1
Or, in general, search online for 'wolfram phase diagram' for more things to help you find relevant items (there is a lot more resources available to you in this area, including on https://demonstrations.wolfram.com )
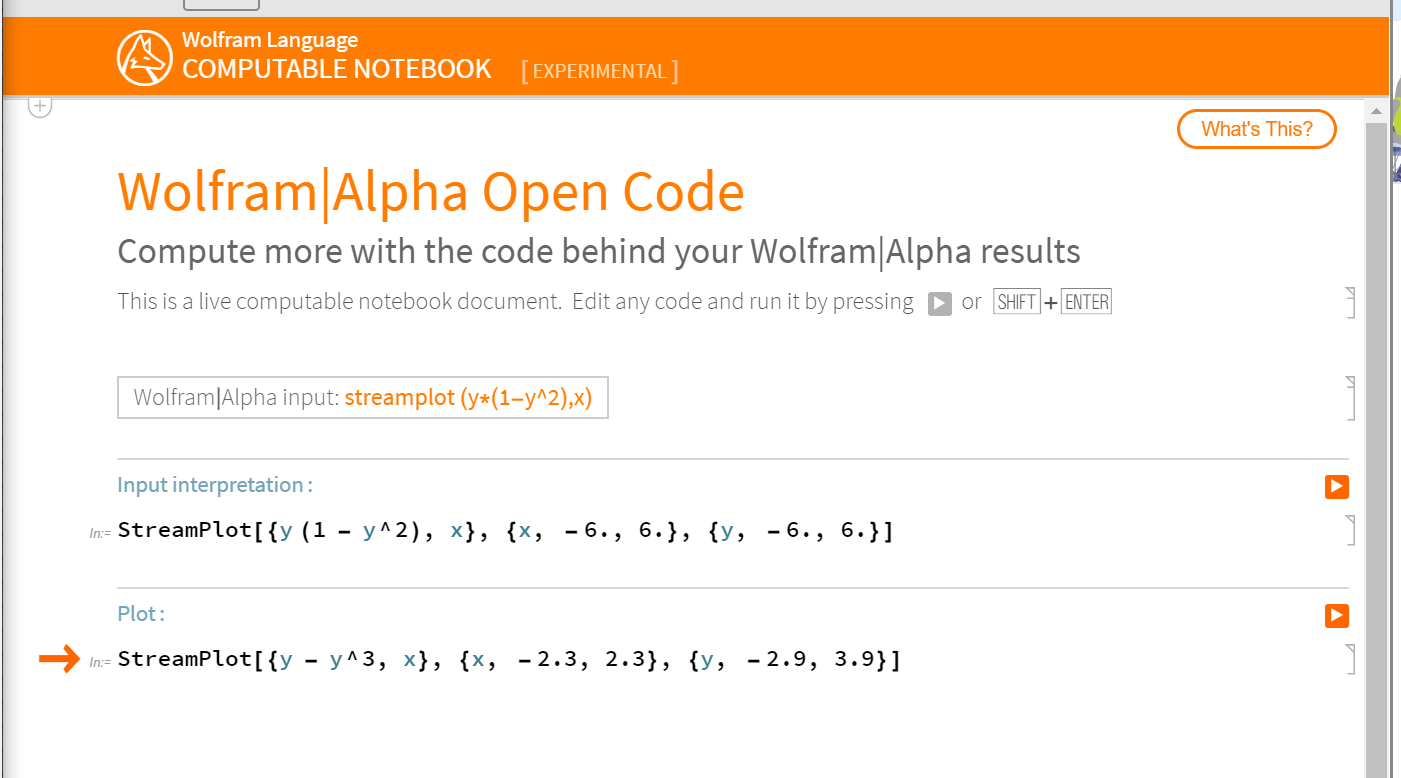
On the main website (not the mobile, I think) you can click the 'Open Code' button:
That should open a Wolfram Cloud notebook:
Does this answer your question?
It helped. Do you know of any other way to plot this?
That is not correct Wolfram Language syntax.
If you are beginning to learn the Wolfram Language syntax, this is a good place to start:
https://www.wolfram.com/language/elementary-introduction/2nd-ed/
Let me know if this helps you or not.
I've tried stream plot (y*(1-y^2),x) but I don't know if this is the correct way of doing it.
What have you tried so far?