Hi,
I could only add the coordinates (lat,lon) on the mercator map. How do I add the cost values on the mercator or ReliefImage of Algeria country?
lat = {36.374698638916`, 35.4379997253418`, 35.4379`, 36.6869`,
36.999`, 35.7501`, 36.6869`, 34.8134994506836`, 36.0624`, 36.6869`,
35.1257019042969`, 36.3746`, 36.3746`, 34.8134994506836`,
33.5646018981934`, 36.999`, 33.2523994445801`, 32.6278991699219`,
36.3746`, 36.6869`, 35.4379`, 33.8768005371094`, 35.4379997253418`,
36.374698638916`, 36.3746`, 36.0624`, 35.7501983642578`,
33.2523994445801`, 35.7501`, 32.0035018920898`, 35.7309`,
35.7501983642578`, 34.8134994506836`, 36.0624`, 35.1257019042969`,
36.999`, 36.3746`, 35.4379`, 35.1257`, 35.4379997253418`, 36.6869`,
35.4379997253418`, 36.6869`, 33.2523994445801`};
lon = {1.875`, 2.5`, -0.9375`, 3.125`, 7.8125`, 6.25`, 5.`, 5.625`,
4.6875`, 3.4375`, 4.0625`, 0.9375`, 6.5625`, 3.125`, 0.9375`,
8.125`, 6.875`, 3.75`, 7.5`, 5.625`, 7.1875`, 2.8125`, 0.3125`,
2.8125`, 6.25`, 0.`, 4.6875`, -0.3125`, -0.3125`, 5.625`, 7.3693`,
0.625`, 0.3125`, 5.3125`, -0.625`, 6.875`, 7.8125`,
7.8125`, -1.875`, 1.25`, 2.5`, 1.5625`, 3.75`, 5.9375`};
Cost = {54.68183772627352`, 25.296814871541176`, 35.12083294481471`,
45.70825674828529`, 61.818237776232344`, 35.42446726505295`,
74.92377718887353`, 13.642979303920589`, 56.67893120235882`,
49.658917258755885`, 39.29168746139118`, 55.67986309064118`,
65.18689721428235`, 35.985996669150005`, 30.229585570791176`,
71.84962567448824`, 7.240818105820588`, 6.416816059402942`,
86.21345113930589`, 81.36879486894705`, 39.39921561397941`,
14.36977644002647`, 39.499343081488234`, 63.160325345011756`,
61.84539697793823`, 47.91312749254412`, 22.548852212611763`,
25.17007391632941`, 39.69543622810588`, 3.999398639179412`,
37.646560668149995`, 36.51949106041765`, 57.915802520779415`,
88.53428844405882`, 39.93599994434118`, 61.96752493132058`,
71.94165348809118`, 39.28684887521471`, 29.742199886099996`,
47.86331884992353`, 42.63178438155882`, 53.17769177839412`,
64.59075504109413`, 6.882828241111764`};
toMercator[{lat_, lng_}] := {lng,
Log[Abs[Sec[lat*Degree] + Tan[lat*Degree]]]/Degree};
mercPoints = toMercator /@ latLngs;
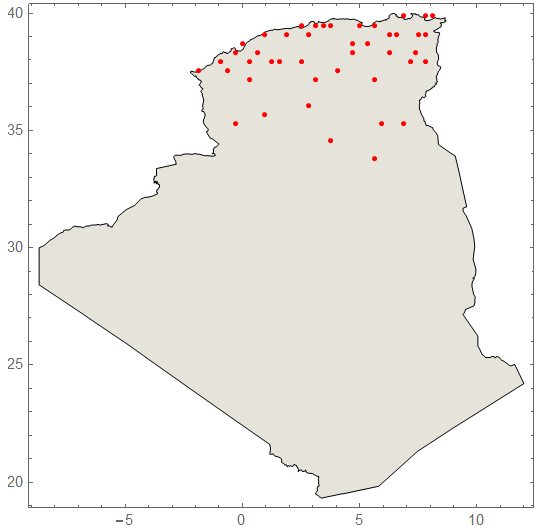
Show[CountryData["Algeria", {"Shape", "Mercator"}], Frame -> True,
Epilog -> {PointSize[0.02], Red, Point[mercPoints]}]