David,
The BarChart[] function takes a nested list of values. For example if you have
BarChart[{ {1,2,3},{4,5,6}}]
You will get 3 different colored bars, a small separation, and 3 more bars-- with the first bars in each set in the same color, the second bars in each set in the second color and the third bars of each set the third color.
Your list only has two bars in each set so you only go through two colors and then it repeats.
Given how this works, there are ways to achieve what you want but I am not sure exactly what that is so I'll guess:
One option is to flatten the list so there is only one set of colors, you can separate the sets with Missing[]. For example:
BarChart[Flatten[{{1, 0.6}, Missing[], {1, 0.5}, Missing[], {1, 0.8},
   Missing[], {1, 0.7}}],
 ChartStyle -> {"DeepSeaColors", "RoseColors", "SolarColors",
   "CandyColors"}, ChartLayout -> "Grouped",
 ChartElementFunction -> "GlassRectangle", Frame -> True,
 ChartLabels -> Placed[{"P", "N", None, "COD", "TSS"}, Below],
 BarSpacing -> None, PerformanceGoal -> "Quality"]
gives
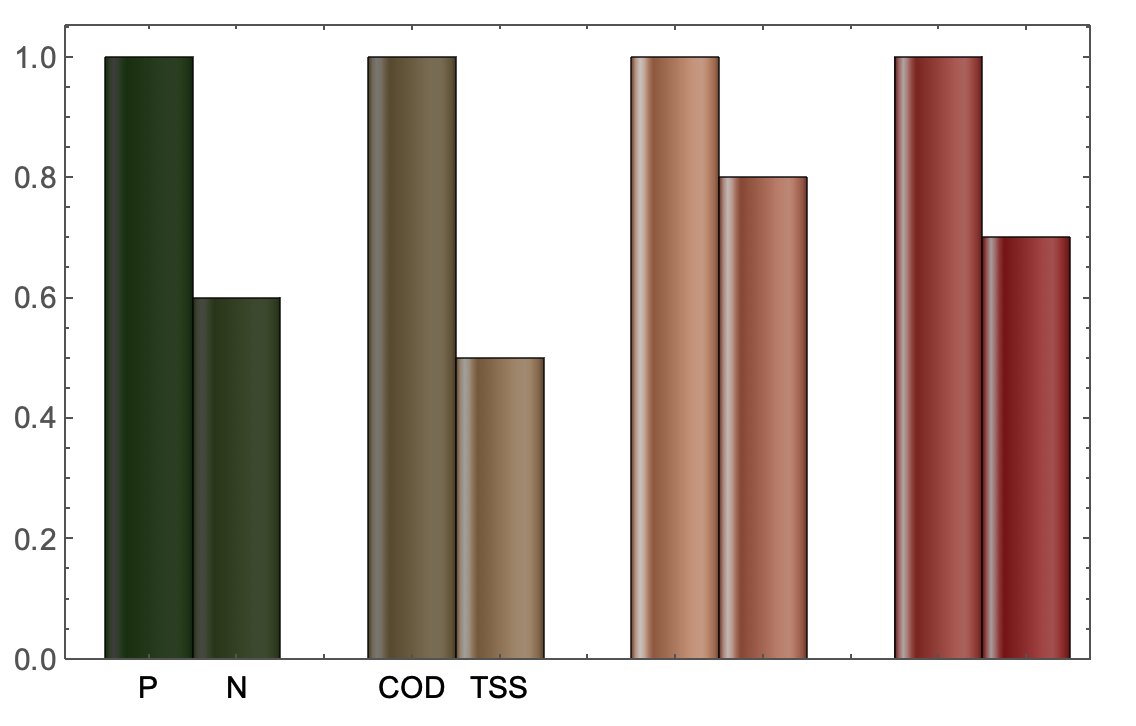 However, I am not sure what colors you really want for each bar but maybe this will help you get started. You had a bug in your labeling that I fixed. Note that you can also use BarSpacing options to separate your bars precisely if the Missing[] approach is unsatisfactory.
Another good option is ChartLegends which will give you a legend showing what each color means.
If you describe in more detail what you want I could be more specific.
Regards,
Neil


