Message Boards Message Boards

0
|
2012 Views
|
1 Reply
|
2 Total Likes
View groups...
Share
Share this post:

[?] Plot a scalar Graph with cylindrical coordinates?

Posted 5 years ago

Hi, I have a scalar Function with two variables F[r,t] in cylindrical coordinates, how can I plot it?

POSTED BY: Pablo Huerta
Posted 5 years ago

Hi Pablo,

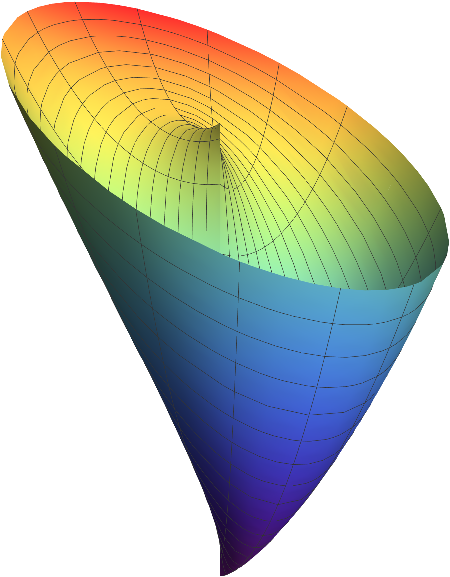
What kind of plot? Something like this?

f[r_, t_] := r^2  + Sin[t]
ParametricPlot3D[{r Cos[t], r Sin[t], f[r, t]}, {r, 0, 1}, {t, 0, 2 Pi},
 ColorFunction -> "Rainbow",
 ViewPoint -> {-Pi/4, -Pi/2, -Pi/6},
 Boxed -> False,
 Axes -> False]

enter image description here

POSTED BY: Rohit Namjoshi
Reply to this discussion
Community posts can be styled and formatted using the Markdown syntax.
Reply Preview
Attachments
Remove
or Discard

Group Abstract Group Abstract