Message Boards Message Boards

0
|
5153 Views
|
2 Replies
|
2 Total Likes
View groups...
Share
Share this post:

Plot a network from a weighted adjacency matrix

Hello everyone,

I have the following weighted adjacency matrix:

M = {{\[Infinity], -164.401, 153.329, 
  12.4378}, {0.00312139, \[Infinity], \[Infinity], \[Infinity]}, \
{0.0351193, \[Infinity], \[Infinity], \[Infinity]}, {-0.00452402, \
\[Infinity], \[Infinity], \[Infinity]}};

What I want is to make a graph out of it. In order to do that, I have tried the following:

G1 = WeightedAdjacencyGraph[M];
degrees = DegreeCentrality[G1];
edges = EdgeList[G1];
weights = DeleteCases[Flatten[M], \[Infinity]];
G = WeightedAdjacencyGraph[{V, n, m, h}, M, GraphLayout -> Automatic,
   PlotTheme -> "Web", VertexLabels -> Placed[Automatic, Center],
  VertexSize\[Rule]Thread[VertexList[G1]\[Rule]degrees], 
  MapThread[
   Property[#1, 
     EdgeStyle -> {ColorData[{"TemperatureMap", "Reverse"}][
        Rescale[#2, MinMax[weights], {0, 1}]], 
       Thickness[
        Rescale[#2, MinMax[weights], {0.001, 0.008}]]}] &, {edges, 
    weights}]]

However, the code gives several errors. Does anyone know how can the code be fixed?

I want the code to return something like this: Example graph
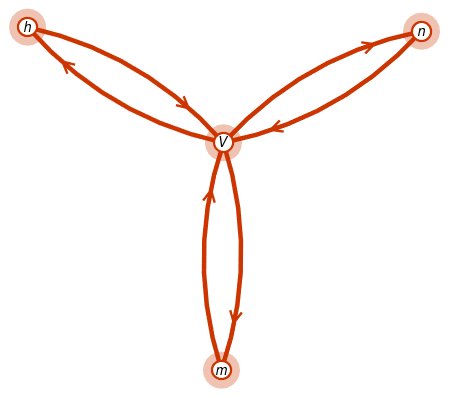
But with vertex sizes proportional to their own degree and edge widths and colors proportional to their own weight.

Thank you in advance for any help!

2 Replies

Thank you very much for your answer!

I have been modifying the code to produce the following:

Result

This is the modified code:

M = Transpose[{{\[Infinity], -164.401, 153.329, 
     12.4378}, {0.00312139, \[Infinity], \[Infinity], \[Infinity]}, \
{0.0351193, \[Infinity], \[Infinity], \[Infinity]}, {-0.00452402, \
\[Infinity], \[Infinity], \[Infinity]}}]; (*Weighted adjacency matrix*)

G1 = WeightedAdjacencyGraph[{V, n, m, h}, M];
nodes = VertexList[G1];
degrees = DegreeCentrality[G1];
edges = EdgeList[G1];
weights = DeleteCases[Flatten[M], \[Infinity]];
G = Graph[G1, GraphLayout -> Automatic, PlotTheme -> "Monochrome", 
  VertexLabels -> Placed[Automatic, Center], 
  VertexSize -> Thread[nodes -> degrees/25], 
  EdgeStyle -> 
   MapThread[#1 -> {ColorData[{"TemperatureMap", "Reverse"}][
        Rescale[#2, Max[Abs[weights]] {-1, 1}, {0, 1}]], 
       Thickness[
        Interpolation[{{0, 0.004}, {Max[Abs[weights]], 0.008}}, 
         Abs[#2], InterpolationOrder -> 1]]} &, {edges, weights}]]

What I want now is to set edge colors and thicknesses in a way that doesn't vary linearly, exagerating distances to 0 in weight, so that small values could be seen a little bit more.

Any idea how to do something like this?

Thanks in advance!

Posted 4 years ago

New graph you are defining have different vertices compared to properties you set. You could set vertices when you define your graph first and do operation you want:

G1 = WeightedAdjacencyGraph[{V, n, m, h}, M];

degrees = DegreeCentrality[G1];
edges = EdgeList[G1];
weights = DeleteCases[Flatten[M], \[Infinity]];

g = Graph[G1, PlotTheme -> "Web", 
  VertexLabels -> Placed[Automatic, Center], 
  VertexSize -> Thread[VertexList[G1] -> degrees/50], 
  EdgeStyle -> 
   MapThread[#1 -> {ColorData[{"TemperatureMap", "Reverse"}][
        Rescale[#2, MinMax[weights], {0, 1}]], 
       Thickness[
        Rescale[#2, MinMax[weights], {0.001, 0.008}]]} &, {edges, 
     weights}]]
POSTED BY: Jaebum Jung
Reply to this discussion
Community posts can be styled and formatted using the Markdown syntax.
Reply Preview
Attachments
Remove
or Discard

Group Abstract Group Abstract