Message Boards Message Boards

0
|
5043 Views
|
2 Replies
|
2 Total Likes
View groups...
Share
Share this post:

Plot a network from a weighted adjacency matrix

Hello everyone,

I have the following weighted adjacency matrix:

M = {{\[Infinity], -164.401, 153.329, 
  12.4378}, {0.00312139, \[Infinity], \[Infinity], \[Infinity]}, \
{0.0351193, \[Infinity], \[Infinity], \[Infinity]}, {-0.00452402, \
\[Infinity], \[Infinity], \[Infinity]}};

What I want is to make a graph out of it. In order to do that, I have tried the following:

G1 = WeightedAdjacencyGraph[M];
degrees = DegreeCentrality[G1];
edges = EdgeList[G1];
weights = DeleteCases[Flatten[M], \[Infinity]];
G = WeightedAdjacencyGraph[{V, n, m, h}, M, GraphLayout -> Automatic,
   PlotTheme -> "Web", VertexLabels -> Placed[Automatic, Center],
  VertexSize\[Rule]Thread[VertexList[G1]\[Rule]degrees], 
  MapThread[
   Property[#1, 
     EdgeStyle -> {ColorData[{"TemperatureMap", "Reverse"}][
        Rescale[#2, MinMax[weights], {0, 1}]], 
       Thickness[
        Rescale[#2, MinMax[weights], {0.001, 0.008}]]}] &, {edges, 
    weights}]]

However, the code gives several errors. Does anyone know how can the code be fixed?

I want the code to return something like this: Example graph

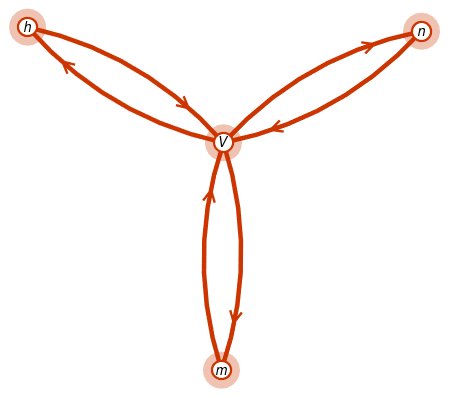
But with vertex sizes proportional to their own degree and edge widths and colors proportional to their own weight.

Thank you in advance for any help!

2 Replies
Posted 4 years ago

New graph you are defining have different vertices compared to properties you set. You could set vertices when you define your graph first and do operation you want:

G1 = WeightedAdjacencyGraph[{V, n, m, h}, M];

degrees = DegreeCentrality[G1];
edges = EdgeList[G1];
weights = DeleteCases[Flatten[M], \[Infinity]];

g = Graph[G1, PlotTheme -> "Web", 
  VertexLabels -> Placed[Automatic, Center], 
  VertexSize -> Thread[VertexList[G1] -> degrees/50], 
  EdgeStyle -> 
   MapThread[#1 -> {ColorData[{"TemperatureMap", "Reverse"}][
        Rescale[#2, MinMax[weights], {0, 1}]], 
       Thickness[
        Rescale[#2, MinMax[weights], {0.001, 0.008}]]} &, {edges, 
     weights}]]
POSTED BY: Jaebum Jung

Thank you very much for your answer!

I have been modifying the code to produce the following:

Result

This is the modified code:

M = Transpose[{{\[Infinity], -164.401, 153.329, 
     12.4378}, {0.00312139, \[Infinity], \[Infinity], \[Infinity]}, \
{0.0351193, \[Infinity], \[Infinity], \[Infinity]}, {-0.00452402, \
\[Infinity], \[Infinity], \[Infinity]}}]; (*Weighted adjacency matrix*)

G1 = WeightedAdjacencyGraph[{V, n, m, h}, M];
nodes = VertexList[G1];
degrees = DegreeCentrality[G1];
edges = EdgeList[G1];
weights = DeleteCases[Flatten[M], \[Infinity]];
G = Graph[G1, GraphLayout -> Automatic, PlotTheme -> "Monochrome", 
  VertexLabels -> Placed[Automatic, Center], 
  VertexSize -> Thread[nodes -> degrees/25], 
  EdgeStyle -> 
   MapThread[#1 -> {ColorData[{"TemperatureMap", "Reverse"}][
        Rescale[#2, Max[Abs[weights]] {-1, 1}, {0, 1}]], 
       Thickness[
        Interpolation[{{0, 0.004}, {Max[Abs[weights]], 0.008}}, 
         Abs[#2], InterpolationOrder -> 1]]} &, {edges, weights}]]

What I want now is to set edge colors and thicknesses in a way that doesn't vary linearly, exagerating distances to 0 in weight, so that small values could be seen a little bit more.

Any idea how to do something like this?

Thanks in advance!

Reply to this discussion
Community posts can be styled and formatted using the Markdown syntax.
Reply Preview
Attachments
Remove
or Discard

Group Abstract Group Abstract