Message Boards Message Boards

1
|
4523 Views
|
10 Replies
|
6 Total Likes
View groups...
Share
Share this post:

How do I display a graphic above an image?

Posted 4 years ago

I'm an advanced Wolfram Language user... really. So why am I asking such a basic question? Because after two hours and drawing on multiple resources, I still can't solve the problem. Let's see if you can help.

I have a graphics object (the Mandelbrot Set) and an image (the Julia Set). They are both 480 pixels wide. The Graphics object is 313 pixels in height and the image is 227 pixels. I would like to display them with the Graphics object above the image (as shown below). So far everything I've tried either shrinks the image, Shrinks both, or gives the image an automatic height placing it too far from the Graphics object. The resulting combination object has to fit into a 480 x 540 pane.

Here's what I want:

enter image description here

Here's the closest I can get so far:

enter image description here

This was achieved with the following line of code:

{ringPlot, 
 Column[{Image[mSet, Magnification -> 1, ImageSize -> Full], 
   Style[jSet, Magnification -> 1]}, ItemSize -> Full]}

The multiple ImageSize and Magnification settings are from me trying to prevent the two objects from being automatically displayed at smaller sizes. I have read all about Column, GraphicsColumn, and related functions. Please help so I can get to the more meaningful parts of this project. : )

Thanks in advance,

Mark Greenberg

POSTED BY: Mark Greenberg
10 Replies

Be careful if you export to pdf a Row[] of graphic objects, because my experience on the Mac is that the size of the Row[] in the pdf will be smaller than expected almost by 30%. For example:

dsk = Graphics[{Circle[], Text["abc"]}, ImageSize -> 250]
Export[NotebookDirectory[] <> "dsk.pdf", dsk]
twoDsks = Row[{dsk, dsk}]
Export[NotebookDirectory[] <> "twodsks.pdf", twoDsks]

In the notebook, twoDsks is twice as wide as dsk, but twodsks.pdf is only 360 pt wide, when I would expect 500 pt. The fonts are also downscaled compared with dsk.pdf. Same problem with Column. I have already reported this issue to Tech Support.

POSTED BY: Gianluca Gorni
Posted 4 years ago

Thanks, Neil. You got me past the sticking point. I'm able to continue with the project. Wrapping both objects in Rasterize[..., ImageSize->n] forced them to display at the correct size inside a column.

I'll try to write a simple recipe to illustrate this issue and send it along to support.

POSTED BY: Mark Greenberg

Mark,

The problem seems to be the ImageResize[]. This operation breaks the sizing. I would report this to support. The difference seems to be that when you resize, it becomes an Image, The original is a Graphics object. If all the objects are Graphics objects it seems to work fine.

If you Rasterize the Images and specify the ImageSize, it works again:

jSet = ImageCrop[
   ImageResize[
    JuliaSetPlot[cPts[[1]], ColorFunction -> "RedGreenSplit", 
     Frame -> False, 
     ImageSize -> {{480}, {227}}], {{480}, {227}}], {480, 227}, 
   Padding -> "Fixed"];
jSetrr = Rasterize[jSet, ImageSize -> 480 ]
Column[{mSet, jSetrr}]

I think that when the Graphics gets converted to Image it must get the DPI changed.

I hope this helps.

Regards,

Neil

POSTED BY: Neil Singer
Posted 4 years ago

Thanks, Rohit. That looks tidy. But what I want is a 480 x 540 composition with the Mandelbrot above and the Julia below. The ringPlot object should not be part of the composition. In retrospect, I should not have included the ringPlot object in this post at all (except that it was part of the output I was working on.) I would like the output to look exactly like the first image I posted. I had to right-click on the miniaturized Julia image to enlarge it, but in this project the images will be created programmatically and the user will not be expected to manually enlarge objects.

POSTED BY: Mark Greenberg

Mark,

I have had the same problem before. The issue is you must specify a size for EVERY plot (not necessarily a number, i.e. Medium works). Once they are fixed, the combination is trivial:

I don't have your plots so I randomly grabbed some examples from the documentation:

g1 = MandelbrotSetPlot[ImageSize -> 400]
g2 = JuliaSetPlot[-1, ImageSize -> 400]
g3 = ParametricPlot[{{2 r Cos[t], r Sin[t]}, {r Cos[t], 
    2 r Sin[t]}}, {t, 0, 2 Pi}, {r, 0, 1}, Mesh -> False, 
  ImageSize -> 200]
Row[{g3, Column[{g1, g2}]}]

This will have repeatable alignment and will respond well to grid/row/column spacing and adjustments. I like to pick a number for the size because everything lines up well. I hope this helps.

Neil

POSTED BY: Neil Singer
Posted 4 years ago

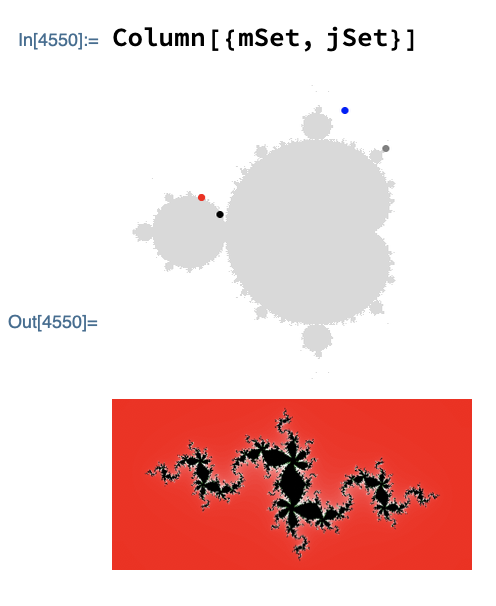
Thanks, Neil, for responding. I apparently did not make myself clear. The part of the output I'm having trouble with is the MandelbrotSetPlot object above the Julia set, which is an image. The Mandelbrot graphic was made with this code:

cPts= {0.0667205 + 0.863948 I, -0.921531 + 0.248067 I, 
 0.349526 + 0.596629 I, -0.788888 + 0.126608 I};

mSet=MandelbrotSetPlot[
 Epilog -> {PointSize[Large], Blue, Point[pts[[1]]], Red, 
   Point[pts[[2]]], Gray, Point[pts[[3]]], Black, Point[pts[[4]]]},
 PlotRange -> {{-1.53, .53}, {-1.1, 1.1}}, Frame -> False,
 ColorFunction -> (If[#3 == 1, GrayLevel[.85], White] &),
 ImageSize -> 300];

The Julia Set was made with this code:

jSet = ImageCrop[ImageResize[
    JuliaSetPlot[cPts[[1]],
     ColorFunction -> "RedGreenSplit",
     Frame -> False,
     ImageSize -> {{480}, {227}}], {{480}, {227}}],
   {480, 227}, Padding -> "Fixed"];

When I try to apply your solution to get what I really want, it shrinks both objects down to thumbnail size. (Don't be fooled by the large size of the screen shot, that's a result of taking a screen shot on a retina display, I think):

enter image description here

POSTED BY: Mark Greenberg
Posted 4 years ago

Epilog references pts, what is the definition of pts?

POSTED BY: Rohit Namjoshi
Posted 4 years ago
pts={{0.0667205, 0.863948}, {-0.921531, 0.248067}, {0.349526, 
  0.596629}, {-0.788888, 0.126608}}

They are points generated on the fly in a specific region of the Mandelbrot set. I later change them to complex numbers.

POSTED BY: Mark Greenberg
Posted 4 years ago

In the definition of mSet, use ImageSize -> {480, 313}. Then does this generate the desired result? The image is not a screen shot, it is the result of saving the cell as PNG.

GraphicsColumn[{mSet, jSet}, Spacings -> 0, AspectRatio -> 1/GoldenRatio]

enter image description here

POSTED BY: Rohit Namjoshi
Posted 4 years ago

Hi Mark,

Have you tried

Column[{Row[{ringPlot, mSet}, Spacer[5]], jSet}, Right]
POSTED BY: Rohit Namjoshi
Reply to this discussion
Community posts can be styled and formatted using the Markdown syntax.
Reply Preview
Attachments
Remove
or Discard

Group Abstract Group Abstract