I am trying to plot this function with Plot3D and ContourPlot and they both give blank boxes. Is there something wrong with my code?
f[x_, y_] = 4*Sin[x - 2] + 4*Cos[y - 4] + 9*x^2 - 5*xy + 1*y^2 - 2*x + 4*y
Note that including Evaluate in the Plot expression cuts the time roughly in half (on my system, from around 0.293 sec to around 0.017 sec).
Evaluate
Plot
This should hardly matter — except, say, if you were going to be changing the function or the plot range dynamically within a Manipulate.
Manipulate
I suggest you use the delayed evaluation ":=". For example,If we set x=1;the define a function x+2 with direct assignment and delayed assignment,respectively.The following answer we will get.
Hi Katelyn,
You did not post the code you tried so it is not possible to identify what is wrong with it.
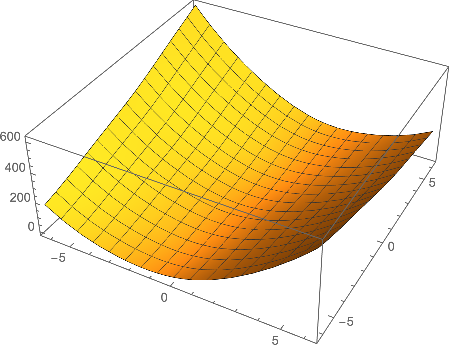
f[x_, y_] := 4 Sin[x - 2] + 4 Cos[y - 4] + 9 x^2 - 5 x y + 1 y^2 - 2 x + 4*y
Plot3D[Evaluate@f[x, y], {x, -2 Pi, 2 Pi}, {y, -2 Pi, 2 Pi}]
Try
f[x_, y_] := 4Sin[x - 2] + 4Cos[y - 4] + 9x^2 - 5x*y + 1y^2 - 2x + 4*y ;
Plot3D[f[x,y],{x,-Pi,Pi},{y,-Pi,Pi}]