I have a function that Wolfram Alpha provides numerical solutions. See image...
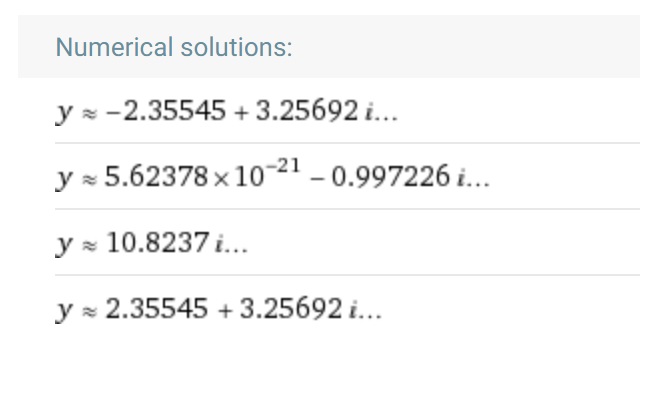
These are clearly not integers and probably not rational numbers. How do I plot this function? Each time I do I get the response "end points are not on curve." See image.
I have tried even using the values Wolfram alpha provided, but I still get the same response. Any ideas how I could plot this? Seems Wolfram Alpha should be able to do it, as it provided me a small handful of great numerical examples. But I would like to plot more.


