Hello everyone. I have constructed a Mathematica output that constructs a Shannon interpolation for different data stored in a vector using the following command:
savedX = Table[XposX = aaa[[All, 1]]; YposX = aaa[[All, 2]];
   windXVal = aaa[[All, i]];
   windXMat = Transpose[{XposX, YposX, windXVal}];
   ifuncEPSX = Interpolation[windXMat //. {x_List} :> x];
   intDataVectorEPSX =
    Flatten[Table[{t, u, ifuncEPSX[t, u]}, {t, xmin, xmax,
       dDeltaX}, {u, ymin, ymax, dDeltaY}]];
   leEPSX = Length@intDataVectorEPSX;
   vectorXintEPSX =
    Table[intDataVectorEPSX[[i]], {i, 1, leEPSX - 2, 3}];
   vectorYintEPSX =
    Table[intDataVectorEPSX[[i]], {i, 2, leEPSX - 1, 3}];
   vectorFintEPSX = Table[intDataVectorEPSX[[i]], {i, 3, leEPSX, 3}];
   interpolatedDataEPSX =
    Transpose[{vectorXintEPSX, vectorYintEPSX, vectorFintEPSX}];
   shannonInterpolationWindX[t_, u_] =
    Total[#3*sinc[(t - #1)/dDeltaX]*sinc[(u - #2)/dDeltaY] & @@@
      interpolatedDataEPSX], {i, 3, countMax + 2}];
Then, if I write savedX[[2]] , I get the following
12.9185 Sinc[0.20944 (0. + t)] Sinc[0.448799 (-65. + u)] +
 7.97354 Sinc[0.20944 (15. + t)] Sinc[0.448799 (-65. + u)]
If I write ContourPlot[ savedX[[2]][t, u], {t, xmin, xmax}, {u, ymin, ymax}, GridLines -> {{xmax, xmin}, None}, PlotLegends -> Automatic], then the resulting output is an empty map.
If in the previous code I wrote
shannonInterpolation[t_, u_]=Total[#3*sinc[(t - #1)/dDeltaX]*sinc[(u - #2)/dDeltaY] & @@@
interpolatedDataEPSX]
and
ContourPlot[
 shannonInterpolationWindX[t, u], {t, xmin, xmax}, {u, ymin, ymax},
 GridLines -> {{xmax, xmin}, None}, PlotLegends -> Automatic]
Then I get the result I want (see attached file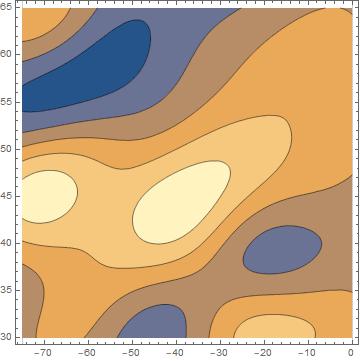 )
)
I am not too familiar with Mathematica, but I see that in this second case, that works, the output looks like Sinc[0.20944 (0. + t_)], the letter t has a '_' behind and this is probably the source of my issue.
Can someone please tell me how to be able to plot the elements of savedX? Any answer is welcome. Regards. Jaime.


