Group Abstract Group Abstract

Message Boards Message Boards

Intensity of light in double slit experiment?

Hi. I calculated the intensity of light in double-slit experiment assuming the wave of light is the sine wave and plotted it in Mathematica.

Manipulate[
 {Graphics[
   {{RGBColor[0, 0.42, 0.65], 
     Line[{{0, -3 10^-6}, {0, 3 10^-6}}]}, {RGBColor[0, 0.42, 0.65], 
     Line[{{L, -3 10^-6}, {L, 3 10^-6}}]}, {Point[{0, 0.5 d}], 
     PointSize[10^-7]}, 
    Text["Slit1", {-0.2, 0.5 d + 0.2 10^-6}], {Point[{0, -0.5 d}], 
     PointSize[Large]}, Text["Slit2", {-0.22, -0.5 d - 0.2 10^-6}], 
    Point[{0, -0.5 d}], Text["Screen", {L + 0.3, 2.8 10^-6}], 
    Point[{L, 0}], Text["Origin", {L + 0.35, -0.2 10^-6}], 
    Line[{{0, -0.5 d}, {L, x}}], Line[{{0, 0.5 d}, {L, x}}], 
    Arrow[{{L + 0.1, 0}, {L + 0.1, x}}], {Thin, 
     Arrow[{{-0.1, -0.5 d}, {-0.1, 0.5 d}}]}, {Thin, 
     Arrow[{{-0.1, 0.5 d}, {-0.1, -0.5 d}}]}, {Thin, 
     Arrow[{{0, -2.9 10^-6}, {L, -2.9 10^-6}}]}, {Thin, 
     Arrow[{{L, -2.9 10^-6}, {0, -2.9 10^-6}}]}, 
    Text["x", {L + 0.25, 0.5 x}], Text["d", {-0.25, 0}], 
    Text["L", {0.5 L, -2.8 10^-6}]},
   AspectRatio -> 1, 
   PlotRange -> {{-0.6, 4}, {-3.5 10^-6, 3.1 10^-6}}, 
   PlotLabel -> "Diagram of the Experiment      ", 
   ImageSize -> Medium],
  Plot[1/(L^2 + (x - 0.5 d)^2) + 1/(L^2 + (x + 0.5 d)^2) + (
    2 Cos[2 Pi Abs[
         Sqrt[L^2 + (x - 0.5 d)^2] - 
          Sqrt[L^2 + (x + 0.5 d)^2]]/\[Lambda]])/(
    Sqrt[L^2 + (x - 0.5 d)^2] Sqrt[L^2 + (x + 0.5 d)^2]), {x, -8, 8}, 
   PlotLabel -> "Intensity of Light in Double Slit Experiment", 
   AxesLabel -> {"x", "Intensity"}, 
   PlotRange -> {{-8.1, 8.1}, {-0.1, 4.1}}, ImageSize -> Large]}
 , {L, 1, 3}, {d, 10^-6, 3 10^-6}, {\[Lambda], 3 10^-7, 
  8 10^-7}, {x, -2.7 10^-6, 2.7 10^-6}]

And I also tried to get an image of the screen in the experiment using DensityPlot function. However, As I make an input and operate it, it always shows such a strange image.

Manipulate[
 DensityPlot[
  1/(L^2 + (x - 0.5 d)^2) + 1/(L^2 + (x + 0.5 d)^2) + (
   2 Cos[2 Pi Abs[
        Sqrt[L^2 + (x - 0.5 d)^2] - 
         Sqrt[L^2 + (x + 0.5 d)^2]]/\[Lambda]])/(
   Sqrt[L^2 + (x - 0.5 d)^2] Sqrt[L^2 + (x + 0.5 d)^2]), {x, -8, 
   8}, {y, 0, 1}, ColorFunctionScaling -> False, 
  ColorFunction -> GrayLevel, AspectRatio -> 0.125, 
  PlotLegends -> Automatic, ImageSize -> Full], {L, 1, 3}, {d, 10^-6, 
  3 10^-6}, {\[Lambda], 3 10^-7, 8 10^-7}]

enter image description here

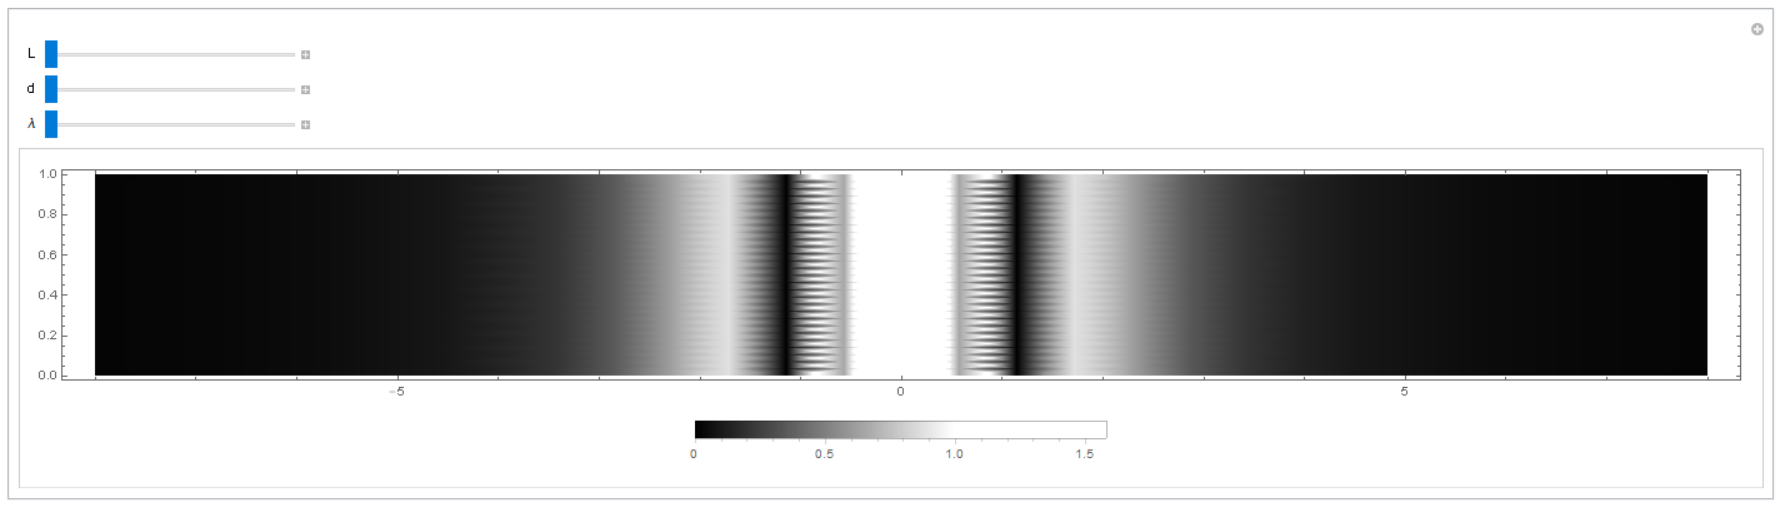
Though I didn't include 'y value' in the expression, there are some horizontal lines in the output image. Could you explain what just happened?

POSTED BY: Wonseok Lee
10 Replies

I just would like to give the advice to do things step by step - one step at a time - and check, if each step is giving something meaningful. If you had done so, you would have noticed, that e.g.

Leng[_L,_u,_v,_r] :=  ...

is certainly not what you want, but rather

Leng[L_, u_, v_, r_] := ...

And it is good practice not to let symbol names start with capital letters.

POSTED BY: Henrik Schachner

Dear Henrick, thank you for your kind helps.

Is there a way to make the body of revolution with a 2D image(eg. a triangle into a cone by rotation)?

By this, I meant to talk about a solid of revolution(eg. rotating a triangle about its base line)(Sorry for my short Eng). And working on the single-slit problem, I got the solution of the amplitude of the light in integral form and tried to make it in a plot in order to check if it's right and how several variables affect the shape of the spectrum. What I wanted to ask was this, but I think I didn't make it clear. Sorry for that.

The solution I got for single-slit problem is:

Leng[_L,_u,_v,_r]:=Sqrt[(u+r)^2 +v^2 +L^2];

Amp[_L,_d,_k,_x]:=Integrate[Sin[k Leng[L, u, v, r]]/Leng[L,u,v,r],
{u,v} \[Element] Circle[{0, 0}, 0.5 d]]/ 
Integrate[1/Leng[L,u,v,r], {u,v} \[Element] Circle[{0,0},0.5d]];

Manipulate[Plot[Amp[L,d,k,x]^2, {x,-8,8}, PerformanceGoal->"Quality", PlotPoints->40,
ImageSize->Large], {L, 1, 3}, {d, 10^-6, 3 10^-6}, {k, 2Pi/3 10^7, 0.25Pi 10^7}]
POSTED BY: Wonseok Lee

Wow, it works! Thank you for your clear answer! Actually, the spectrum graph of the function mentioned upon doesn't respond smoothly as I control the slide by Manipulate function and I should wait until the spectrum becomes smooth. Then is this problem similar to this and able to be solved in the same way?

POSTED BY: Wonseok Lee

Actually, the spectrum graph of the function mentioned upon doesn't respond smoothly as I control the slide by Manipulate function ...

This probably can be improved by using the option PerformanceGoal within Plot:

Plot[   ...   , PerformanceGoal -> "Quality"]
POSTED BY: Henrik Schachner

Dear Henrik, Thank you for your reply. Problems are gone! But what's the difference between

DensityPlot[  ...  ,PlotPoints -> 50]

and

ImageAdjust@Image[ConstantArray[Table[  ...  ]

?

POSTED BY: Wonseok Lee

Dear Wonseok Lee, glad to help!

But what's the difference between ...

With Table[ ... ] the values of just a single line of pixels is calculated, and with ConstantArray[Table[ ... ], 300] this line is simply replicated 300 times. DensityPlot can not know that all lines are identical and so the same sequence of calculations is done for every line.

POSTED BY: Henrik Schachner

Oh, I got it. The method you explained is 'making one line and replicate it many times', right? Nowadays, I'm working on the single-slit diffraction problem to make the screen image. However, to calculate the Plot3D, it takes too much running time. Is there a way to make the body of revolution with a 2D image(eg. a triangle into a cone by rotation)?

POSTED BY: Wonseok Lee

However, to calculate the Plot3D, it takes too much running time.

You are probably talking about doing it like so:

intens[L_, d_, \[Lambda]_, x_] := 
  1/(L^2 + (x - 0.5 d)^2) + 
   1/(L^2 + (x + 0.5 d)^2) + (2 Cos[
       2 Pi Abs[
          Sqrt[L^2 + (x - 0.5 d)^2] - 
           Sqrt[L^2 + (x + 0.5 d)^2]]/\[Lambda]])/(Sqrt[
       L^2 + (x - 0.5 d)^2] Sqrt[L^2 + (x + 0.5 d)^2]);
Manipulate[
 Plot3D[intens[L, d, \[Lambda], x], {x, -5, 5}, {L, 1, 3}, 
  PlotRange -> All, PerformanceGoal -> "Quality", PlotPoints -> 40, 
  ImageSize -> Large, MeshFunctions -> {#3 &}, 
  ColorFunction -> "TemperatureMap"],
 {d, 10^-6, 3 10^-6}, {\[Lambda], 3 10^-7, 8 10^-7}]

Yes, generating such a Plot3D within Manipulate is painfully slow. But this is not very surprising, because a lot of calculation needs to be done. I do not know what you mean by:

Is there a way to make the body of revolution with a 2D image(eg. a triangle into a cone by rotation)?

One standard way if calculations need to be done faster is to use Compile:

cIntens = 
  Compile[{{L, _Real}, {d, _Real}, {\[Lambda], _Real}, {x, _Real}}, 
   Module[{pls, min, sqrpls, sqrmin},
    pls = L^2 + (0.5` d + x)^2;
    min = L^2 + (-0.5` d + x)^2;
    sqrpls = Sqrt[pls];
    sqrmin = Sqrt[min];
    1/min + 1/pls + 2 Cos[2 Pi/\[Lambda] Abs[sqrmin - sqrpls]]/(sqrmin sqrpls)], 
   RuntimeOptions -> "Speed", CompilationTarget -> "C"];

Manipulate[
 Plot3D[cIntens[L, d, \[Lambda], x], {x, -5, 5}, {L, 1, 3}, 
  PlotRange -> All, PerformanceGoal -> "Quality", PlotPoints -> 40, 
  ImageSize -> Large, MeshFunctions -> {#3 &}, 
  ColorFunction -> "TemperatureMap"],
 {d, 10^-6, 3 10^-6}, {\[Lambda], 3 10^-7, 8 10^-7}]

enter image description here

This is still somewhat slow, but much better. If you do not have a C-compiler installed on you system, then just leaf the option CompilationTarget -> "C" away.

POSTED BY: Henrik Schachner
Posted 6 years ago

Dear Henrick, thank you for your kind helps.

Is there a way to make the body of revolution with a 2D image(eg. a triangle into a cone by rotation)?

By this, I meant to talk about a solid of revolution(eg. rotating a triangle about its base line)(Sorry for my short Eng). And working on the single-slit problem, I got the solution of the amplitude of the light in integral form and tried to make it in a plot in order to check if it's right and how several variables affect the shape of the spectrum. What I wanted to ask was this, but I think I didn't make it clear. Sorry for this.

The solution I got for single-slit problem is:

Leng[_L,_u,_v,_r]:=Sqrt[(u+r)^2 +v^2 +L^2];

Amp[_L,_d,_k,_x]:=Integrate[Sin[k Leng[L, u, v, r]]/Leng[L,u,v,r],
{u,v} \[Element] Circle[{0, 0}, 0.5 d]]/ 
Integrate[1/Leng[L,u,v,r], {u,v} \[Element] Circle[{0,0},0.5d]];

Manipulate[Plot[Amp[L,d,k,x]^2, {x,-8,8}, PerformanceGoal->"Quality", PlotPoints->40,
ImageSize->Large], {L, 1, 3}, {d, 10^-6, 3 10^-6}, {k, 2Pi/3 10^7, 0.25Pi 10^7}]
POSTED BY: Updating Name

Hello Wonseok Lee,

I guess this effect is due to insufficient resolution of your DensityPlot. You can fix this using the option PlotPoints, e.g.:

DensityPlot[    ...      , PlotPoints -> 50]

then the whole image looks a bit different (i.e. more correct), but Manipulate works very slowly. An alternative way (my suggestion) might be to use Image, e.g.:

Manipulate[
 ImageAdjust@Image[ConstantArray[
   Table[1/(L^2 + (x - 0.5 d)^2) + 
     1/(L^2 + (x + 0.5 d)^2) + (2 Cos[
         2 Pi Abs[
            Sqrt[L^2 + (x - 0.5 d)^2] - 
             Sqrt[L^2 + (x + 0.5 d)^2]]/\[Lambda]])/(Sqrt[
         L^2 + (x - 0.5 d)^2] Sqrt[L^2 + (x + 0.5 d)^2]), {x, -8, 
     8, .005}], 300]], {L, 1, 3}, {d, 10^-6, 3 10^-6}, {\[Lambda], 
  3 10^-7, 8 10^-7}]

Regards -- Henrik

POSTED BY: Henrik Schachner
Reply to this discussion
Community posts can be styled and formatted using the Markdown syntax.
Reply Preview
Attachments
Remove
or Discard