First your image is added:
img = 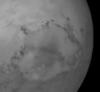
Looking at the Dimensions you can see it has 3 color channels:
ImageData[img] // Dimensions
Therefore it is converted to Grayscale.
img2 = ColorConvert[img, "Grayscale"]
The graylevel coding is also inverted to match the use of Arrayplot, the array data are retrieved using ImageData
idata = ImageData[ColorNegate[img2]];

dims = idata // Dimensions

ArrayPlot[idata]
Now the array data is reorganized to fit ListPlot3D. First a matrix is created that holds the 2D indices plus a placeholder for the GrayLevel
lst = Outer[{#1, #2, 0} &, Range[First[dims]], Range[Last[dims]]];
Next the GrayLevel data are reconfigured to macth this format in order to be able to add both together
lst2 = Map[{0, 0, #} &, idata, {2}];
lst3 = lst + lst2;
Finally the data is displayed using ListPlot3D
ListPlot3D[Flatten[lst3, 1]]
Using Image the data can be converted back into a image, and a colornegate is required
ColorNegate[Image[idata]]


