Is there a way to recreate charts like this in Mathematica?
It plots the percentage changes in multiple time series on the same chart. So for a timeseries t(x), this is plotting y(x) = (t(x)-t(0)/t(0)) * 100.
Ideally I want to plot these using a TradingChart so we get interactivity too.
TradingChart
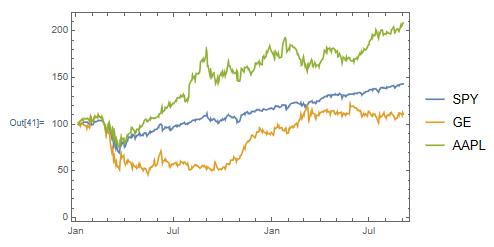
Hi Ankit -- This is what I could come up with
DateListPlot[
 FinancialData[{"SPY", "GE", "AAPL"}, "CumulativeReturn", {2020}],
 PlotLegends -> {"SPY", "GE", "AAPL"}]