I am trying to reproduce the plots in this post Finding outliers in 2D and 3D numerical data with my own data.
However, I am new to the Wolfram language (I used to use R). I don't quite understand what's going on in the code. Here're some rows of my data: *I attach the whole dataset at the end 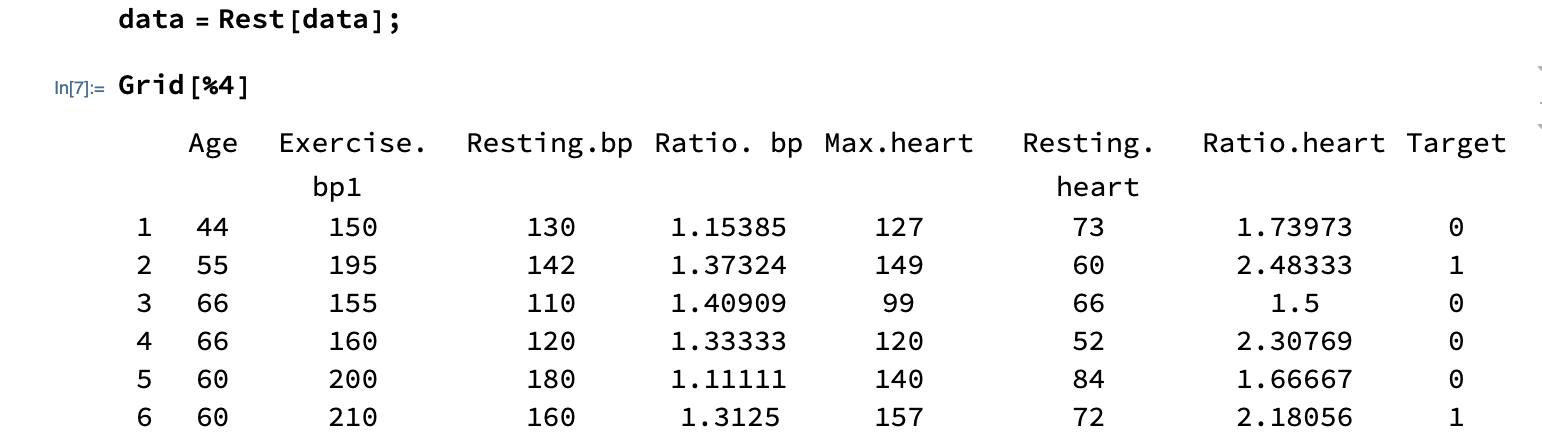
I want to create a 3D Quantile Regression envelopes to find the outliers as in the post, with the variables Age, Ratio.bp, and Ratio.heart. However, I can't get any the plots. Here's an example: 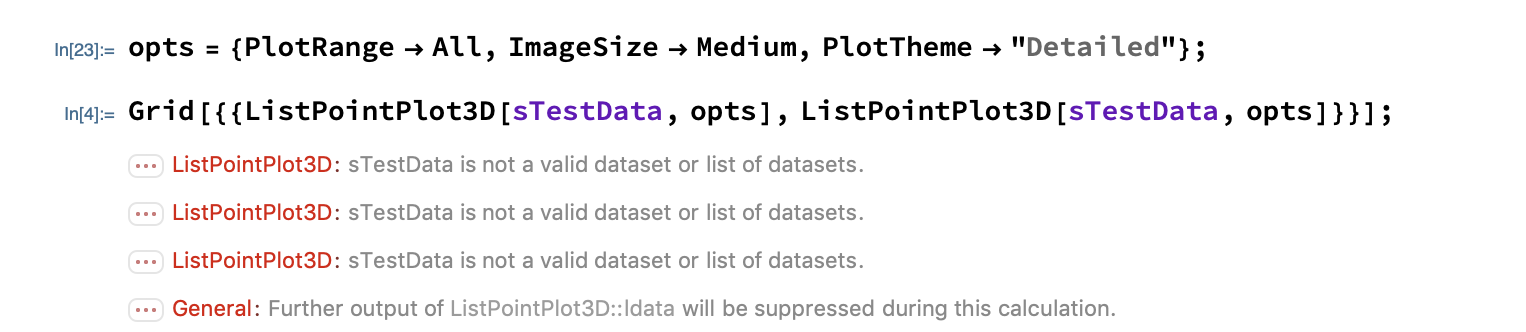
Here's my code:
testData = N@data[[All, {2, 5, 8}]]; sTestData = Transpose[Standardize /@ Transpose[N@testData]];
Block[{offset = -2 (Min /@ Transpose[sTestData])},    sTestData = Map[# + offset &, sTestData]];
opts = {PlotRange -> All, ImageSize -> Medium,     PlotTheme -> "Detailed"};
Grid[{{ListPointPlot3D[sTestData, opts],     ListPointPlot3D[sTestData, opts]}}]
What did I do wrong?
I don't know how to upload the file, but I put my file in R and here's the code: https://codeshare.io/alRLNY
I uploaded the csv file: http://www.sharecsv.com/s/3676944d24cb54ae4adcd8d34e0f2435/newdata.csv
Thank you :)


