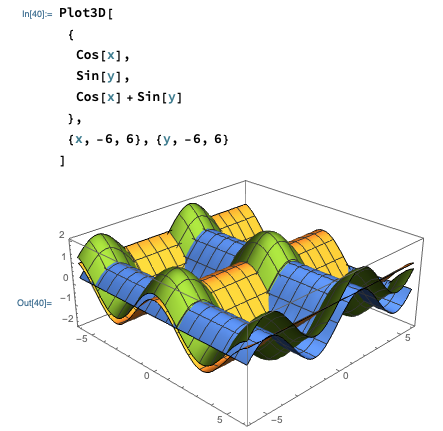
Is this what you had in mind?
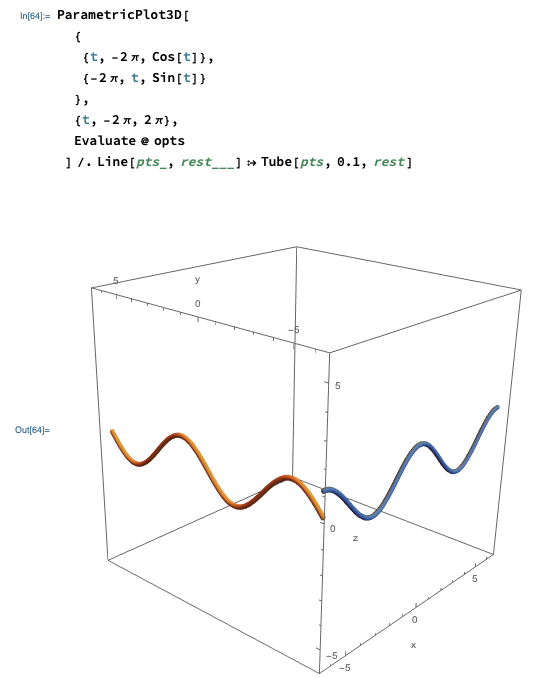
And here's a way to plot the variation with x and y separately, by putting tubes on the coordinate planes. The last line is just to have nice tubes instead of just one-dimensional-looking curves. To be honest, I'm still unsure how /. Line[pts, rest__] :> Tube[pts, 0.1, rest] works exactly, I just got it from somewhere in the Mathematica Help, for "Tubes", I think.
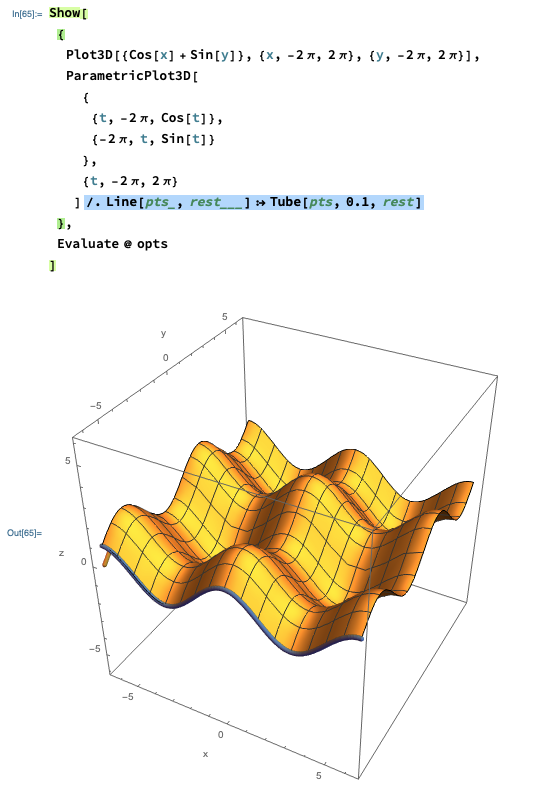
And finally, we can combine the plots using Show[ ], placing the options at the end.
Let me know if there are any questions.
 Attachments:


