I'm working in as public nonprofit website to show Brazil Covid-19 cases (https://covid.looqbox.com), and would like to know how can I use the models in:
https://community.wolfram.com/groups/-/m/t/1888335 https://community.wolfram.com/groups/-/m/t/1896178
In the forecast of Covid-19 spreading in my country (or any other).
To get any country data, I'm using www.ecdc.europa.eu information
getCovidDataECDC[date_String]:= Module[{r, url, file, heads},
    heads = {"date","day","month","year","cases","deaths","country","geoId"};
    url = "https://www.ecdc.europa.eu/sites/default/files/documents/COVID-19-geographic-disbtribution-worldwide-"<>date<>".xlsx";
    r = First@Import@URLDownload[url]/.(d_DateObject :> DateString[d, {"Year", "-", "Month", "-", "Day"}]);
    r = AssociationThread[heads -> #]&/@Rest@r//KeyDrop[{"day", "month", "year"}];
    r
]
$covidDataECDC = getCovidDataECDC["2020-03-20"]
And you can get a country data using:
getCountryData // ClearAll
getCountryData[countryCode_, arg_]:= getCountryData[countryCode][arg]
getCountryData[countryCode_]:= Module[{data},
    data = Select[$covidDataECDC, #[["geoId"]] == countryCode&];
    data = SortBy[data, #[["data"]]&];
    data[[All, "casesAcc"]] = Accumulate@data[[All, "cases"]];
    data[[All, "deaths"]] = Accumulate@data[[All, "deaths"]];
    <|"population"-> CountryData[countryCode, "Population"]
    , "data"-> data
    |>
]
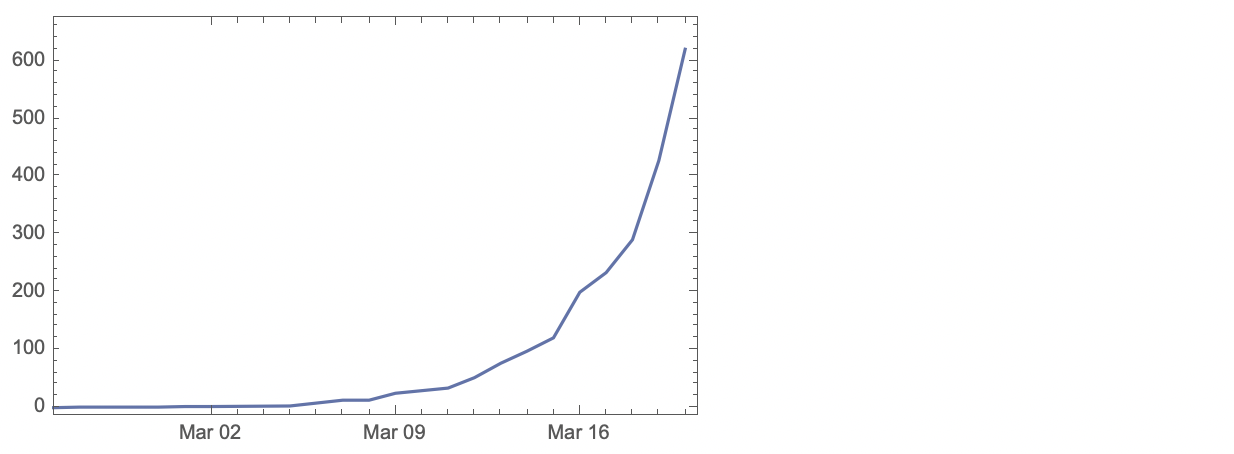
As you can see, things are starting to getting exponential here:
DateListPlot[
            getCountryData["BR", "data"][[All, {"date", "casesAcc"}]]
        , PlotRange->{{"2020-02-25", "2020-03-20"}, All}
]
Any clue?


