Can anybody explain or reproduce these weird results with Callout and Manipulate.
lets make some data with Callout.
dat = {
   Callout[Table[{x, Sin[x]}, {x, 0, 10, .1}], "Sin"],
   Callout[Table[{x, Cos[x]}, {x, 0, 10, .1}], "Cos"],
   Callout[Table[{x, Abs[Cos[x + 0.5]]}, {x, 0, 10, .1}], "Abs[Cos]"]
   };
dat1 = {
   Callout[Table[{x, Sin[x]}, {x, 0, 10, .1}], "Sin"],
   Callout[Table[{x, Cos[x]}, {x, 0, 10, .1}], "Cos"]
   };
And now try to plot this data.
ListLinePlot[dat]
Manipulate[ListLinePlot[dat], {n, 1, 10}]
Manipulate[ListLinePlot[dat[[1 ;; 2]]], {n, 1, 10}]
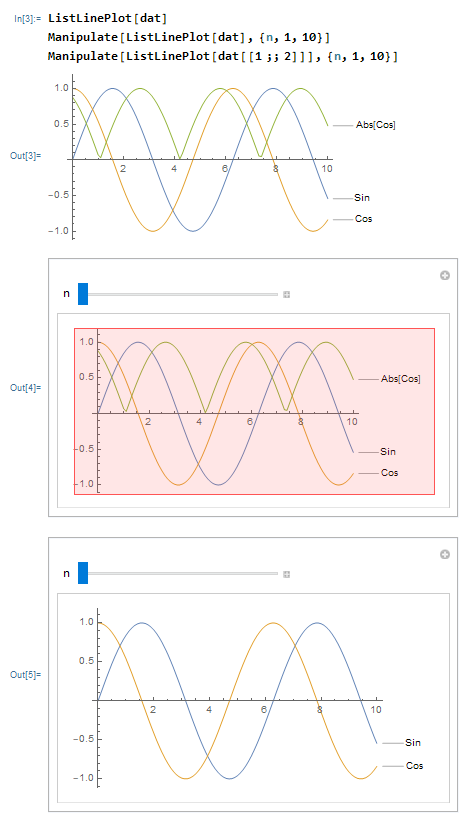
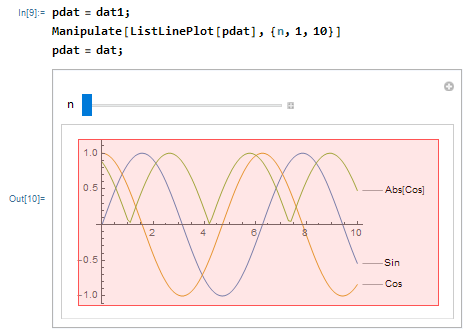
Now the weird thing is this works, first creating the plot with only two lines and then in a new cell change the plot data.
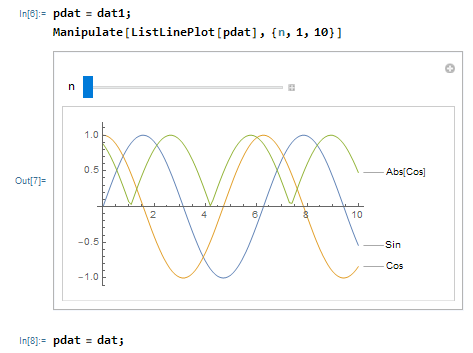
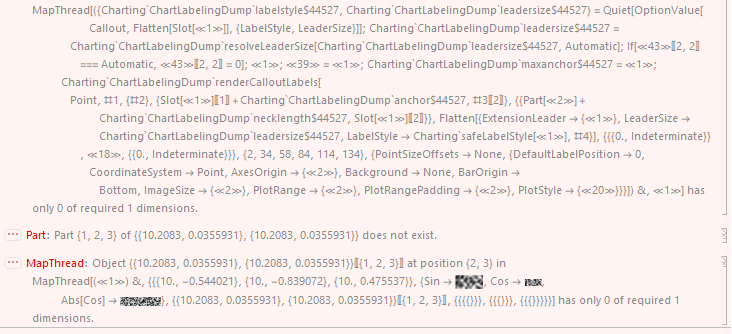
However, when doing this in one cell it fails.
This is the error generated.
 Attachments:


