It is pretty amazing that the Wolfram team provides us with daily updates for covid-19 data and we all have seen by now many charts how it develops, but I have seen few media outlets doing short-term prognosis of e.g. confirmed cases and the long term ones with bell curves usually lack scales (on both axis). So I put together a few helper functions in the included notebook so you can choose the geographies you are most interested in and create your own trending or progosis (I use the simplistic thing doing an exponential trend with the 8 latest days of data). The result currently looks something like this: 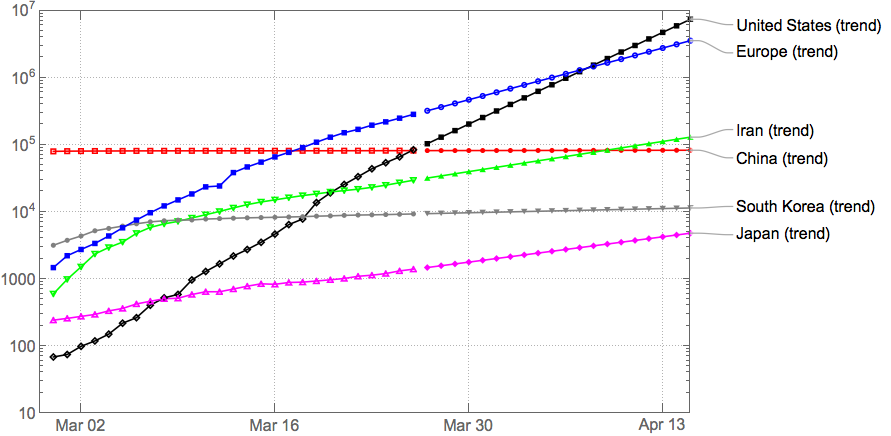 My hope is it creates motivation to follow the restrictions imposed to flatten out the impact or for other people in the community to do more advanced trends or illustrate the models provided in other posts and streams from Wolfram recently.


