Message Boards Message Boards

1
|
3984 Views
|
1 Reply
|
3 Total Likes
View groups...
Share
Share this post:

Import fin json format and data processing

Dear friend, I import de covid-19 data from an Spain region

Import["https://analisis.datosabiertos.jcyl.es/explore/dataset/situacion-de-hospitalizados-por-coronavirus-en-castilla-y-leon/download/?format=json&timezone=Europe/Madrid&lang=es&use_labels%20_for%20_header=true"]

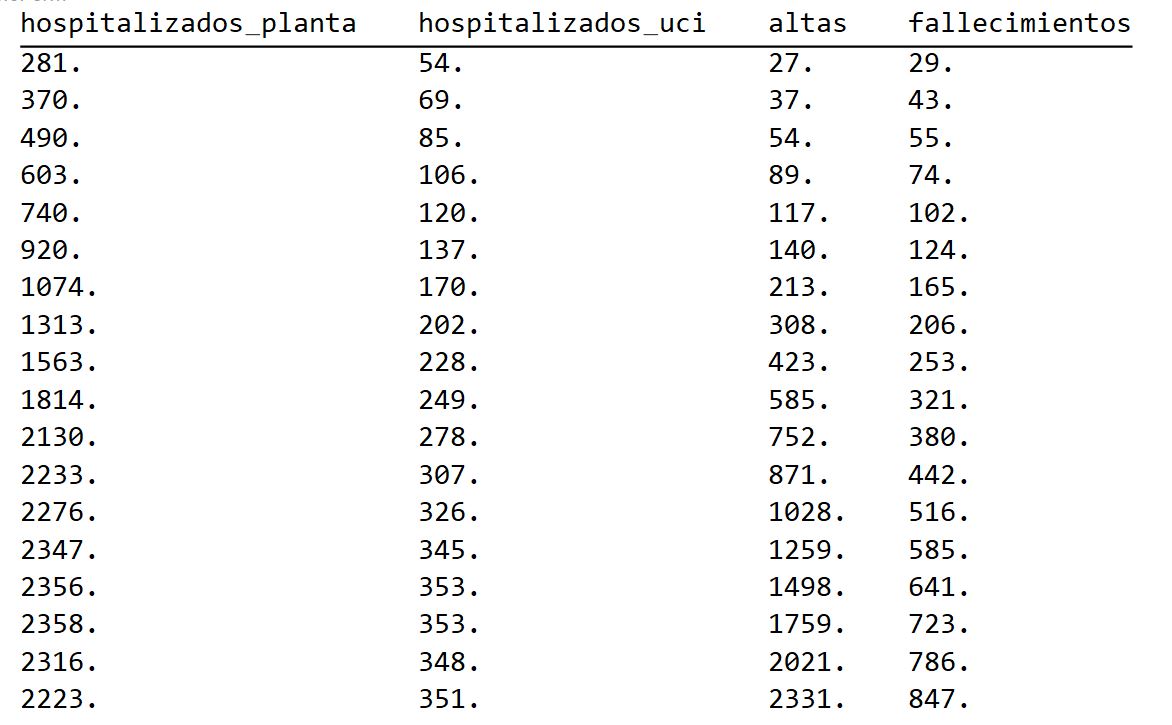
The field (in the head) are the following: {"fecha" (date), "hospital" (name of hospital), "provincia"(province), "hospitalizadosplanta" (hopital inward), "hospitalizadosuci" (uci), "altas" (healed), "fallecimientos" (deads), "codigoine"}

Delete the fields: "hospital" (name of hospital), "provincia"(province), "codigo_ine"

then for each date group the total for the fields "hospitalizadosplanta" (hopital inward), "hospitalizados_uci" (uci), "altas" (healed), "fallecimientos" (deads)

Below I show the ouput that I have obtained , however I have used a a convoluted method , I think easier method could be used Output

Maybe like this?

asc = Import[
   "https://analisis.datosabiertos.jcyl.es/explore/dataset/situacion-\
de-hospitalizados-por-coronavirus-en-castilla-y-leon/download/?format=\
json&timezone=Europe/Madrid&lang=es&use_labels%20_for%20_header=true",
    "RawJSON"];

ds = Dataset[asc]

fieldNames = {"hospitalizados_planta", "hospitalizados_uci", "altas", "fallecimientos"};

ds[All, "fields"][GroupBy["fecha"], Total, fieldNames]

enter image description here

You could also use

data = ds[All, "fields"][GroupBy["fecha"] /* KeyMap[DateObject], Total, fieldNames]

and then plot:

data[DateListPlot, "hospitalizados_planta"]
POSTED BY: Szabolcs Horvát
Reply to this discussion
Community posts can be styled and formatted using the Markdown syntax.
Reply Preview
Attachments
Remove
or Discard

Group Abstract Group Abstract