MODERATOR NOTE: Wolfram notebooks are attached at the end of the post. For more coronavirus resources, updates, and discussions see: https://wolfr.am/coronavirus
By now you have all heard that fighting the Corona virus is all about flattening the curve. It sounds easy, doesn't it?
However, despite that the maths behind the scenes is rather simple, flattening the curve turns out to be quite complicated. What happens if you don't do enough? How important is timing? What's the risk of doing too much?
With the help of System Modeler, the Wolfram Language, and my wonderful colleagues (thanks for having patience with me) I have developed a COVID-19 - Policy Simulator. The ambition is not to give any precise numbers, but to make it easier to understand how simple yet at the same time complicated it is to control a pandemic.
While developing the simulator I realized that my intuition was far from correct in many cases. I doubted the results more than once, and was sure there were mistakes in the model, but most of the time it turned out that it was not the model faulting - it was my intuition. Will your intuition be better than mine? Download the recently released HighSchoolBiology Virtual Lab 1.1 and use it together with this notebook to test your intuition!
The screenshot below shows a naive attempt to set policies. As seen it leads to a disaster at the end of the year.
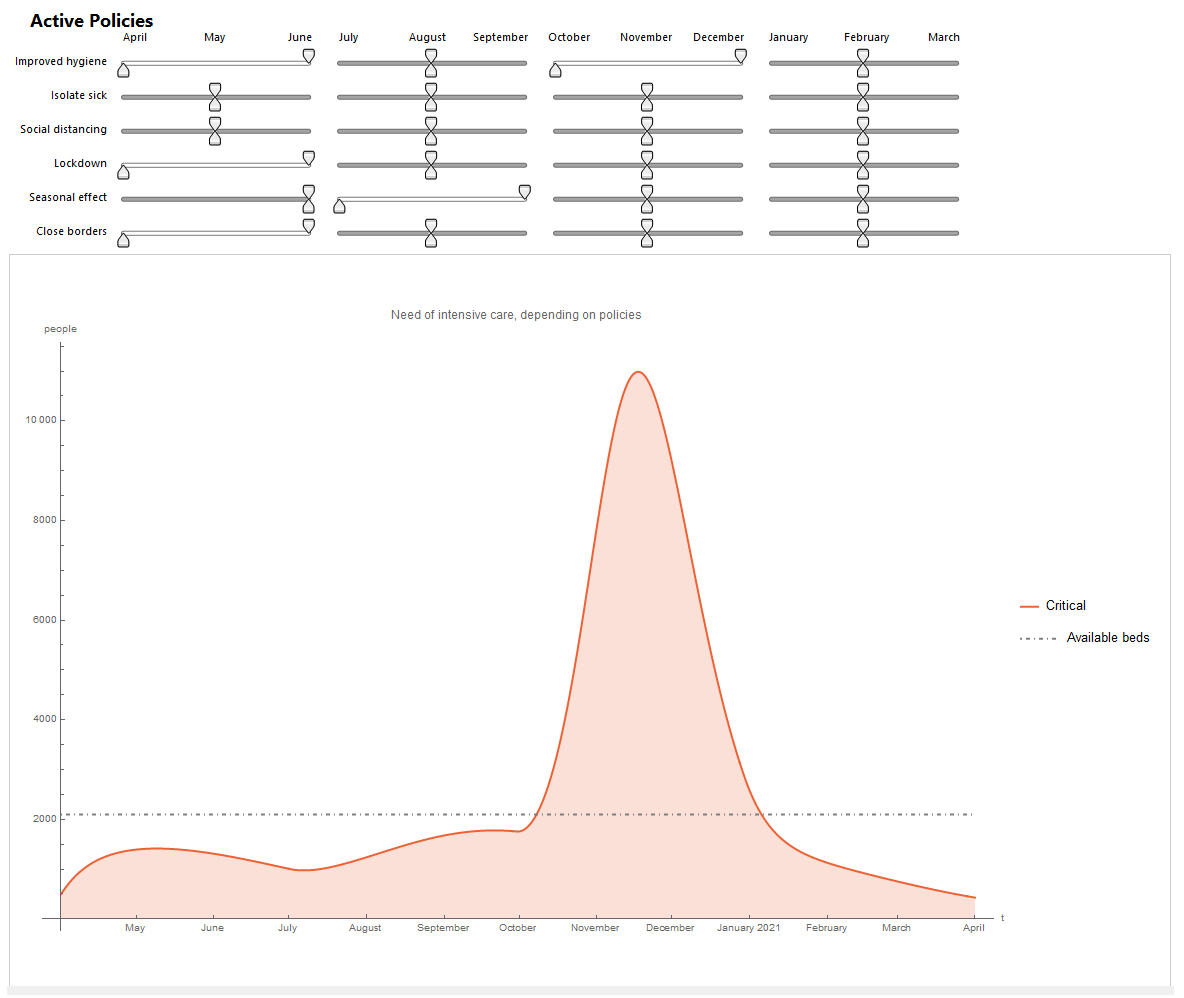
I hope that using this simulator should give you a good idea of how complex it is to find the optimal path through a pandemic, and also to some extent why a recipe that works in one country does not apply to another.
The simulator
Important: Let me repeat that the simulator is not exact. Many rather rough assumptions are made for several different reasons. Most of these , but not all, are mentioned and discussed in a separate notebook. The development notebook shows how I proceeded to roughly tune the default parameters, so they reflect the state in Sweden in the beginning of April 2020. As countries differ in population density, traditions, political structure, age distribution, healthcare system, and so many other things the impact of different policies will vary substantially between countries. Therefore, I made it possible to vary the impact of the policies I have chosen to use. Is your country already very socially distant? Then, further social distancing will probably not have as big of an effect as in other places, and so on. In most cases the simulator allows you to modify some of the assumptions by your self.
In this simulator you can enact the following policies:
- Improved hygiene (washing hands, cough in elbow, don't touch your face, etc)
- Social distancing (keep away from each other, no handshaking, work from home, etc)
- Isolate the sick (even stricter social distancing when your sick)
- Lockdown (close restaurants, schools, shops)
- Seasonal effect (not really a policy, but something that you might hope for.., but will it always be beneficial on the long run?)
- Close borders (when borders are closed, they are hermetically closed, so no infected persons at all enter the region)
Applying policies will typically decrease the exponential growth rate. However, if you have already enacted lockdown, then social distancing will give no further effects. In reality it might actually do that, however to avoid making the simulator overly complicated I have chosen this simplified solution. Other things that I have omitted are e.g. testing, masks, and tracking apps (partially because I have limited data to tune the model with, but mostly to keep the simulator simple).
 On the right hand side of the simulator you can change several settings, including
- Infection properties
- Default is set to the currently believed mean values
- Policy effects
- The first five, will reduce the exponential growth
- Close borders, when the borders are not closed the number shows how many persons per 100k susceptible that are infected by travelling abroad each day
- Initial setting
- Change population and current state, e.g. start with no infected
- Vaccination
- Enact a vaccination policy, setting start date and how many percent of the susceptible population that is vaccinated per day
- Healthcare
- Set the number of available beds
- Additional plots
- Default - Adds a plot using the default values, to make it easier to see the effect of your current policies and changed assumptions
- No policies - Adds a plot using your current assumptions, but no policies
- Beds - Show the number of beds
- Susceptible, infected, and recovered - Add any of these three to the plot
- Simulation end time
- By default the plot is zoomed in to 120 days, to see what happens later (or to zoom in at earlier stages), you can change this.
Note again that there are many measures that are not included, but I believe these are the most important in order to understand the dynamics of a pandemic. Furthermore, I am assuming that the effect of an active policy does not change over time. In reality, of course, a lockdown is likely to me more respected in the beginning then after a few months. Finally, I am completely disregarding both short and long term side effects that policies might have, e.g. effects on economy, education, and healthcare.
Note that you can use the menus on the top right of the simulator to
- Hide controls
- Paste snapshot
- Reset to default values
Try to set your best policy, and comment on the strengths and weaknesses you see with it. If you like you can send us an email to virtuallabs@wolfram.com with your strategy or suggestions for improvements. Note, that by including a snapshot in your answer, you make it easier for us to see what you have done.
Example strategies
Let's just conclude this by showing three strategies:
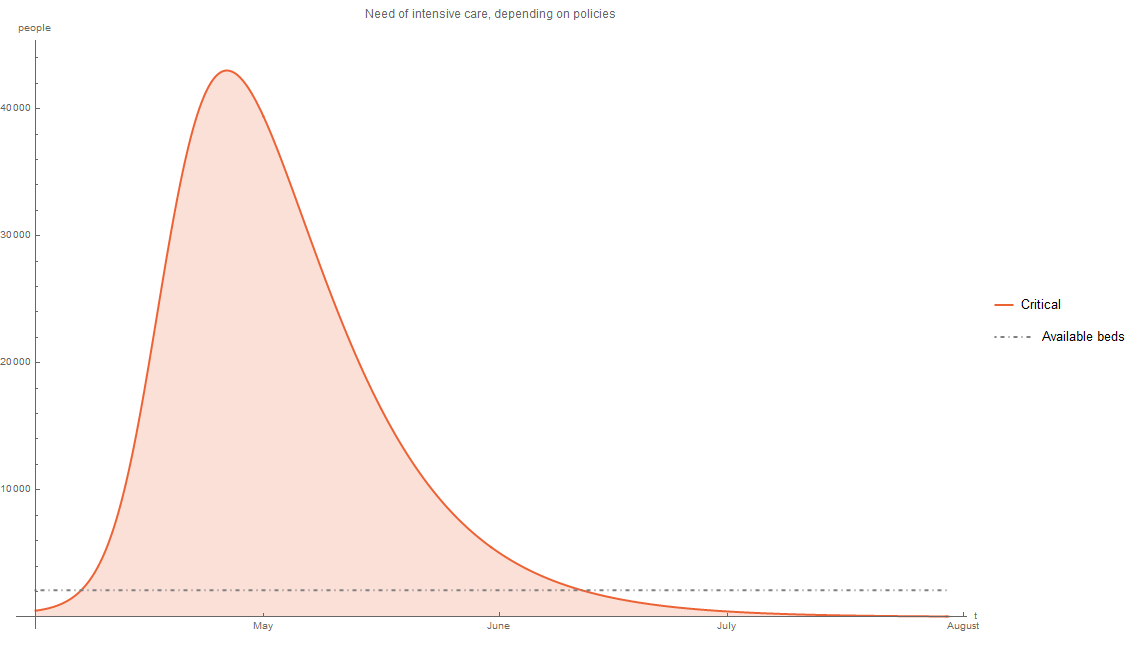
- Do nothing
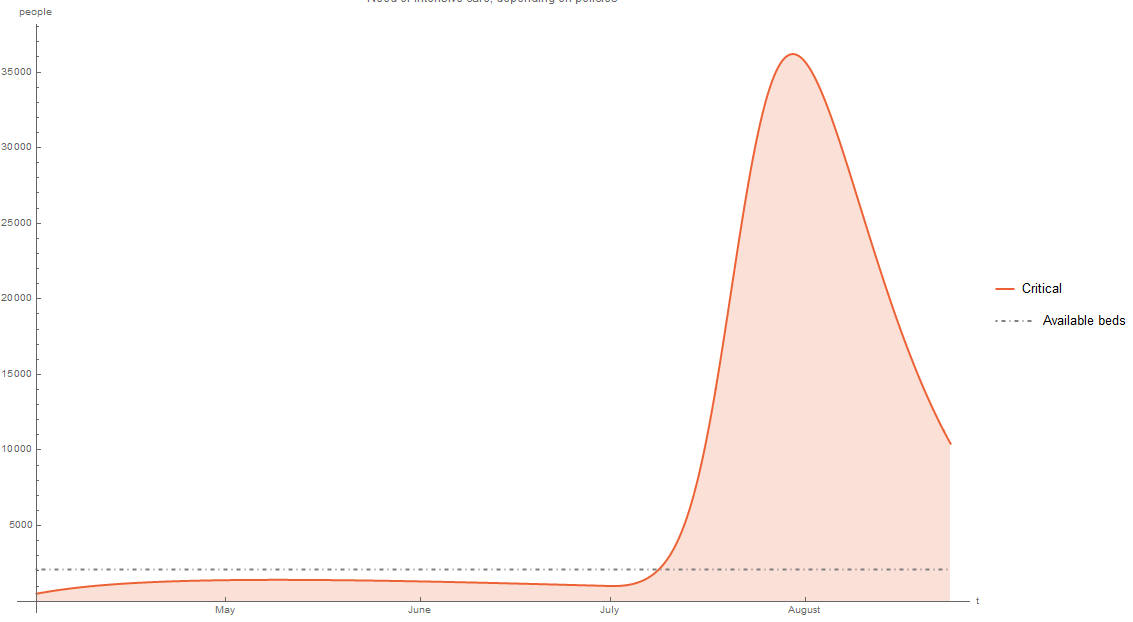
- Complete lockdown -waiting for a vaccine
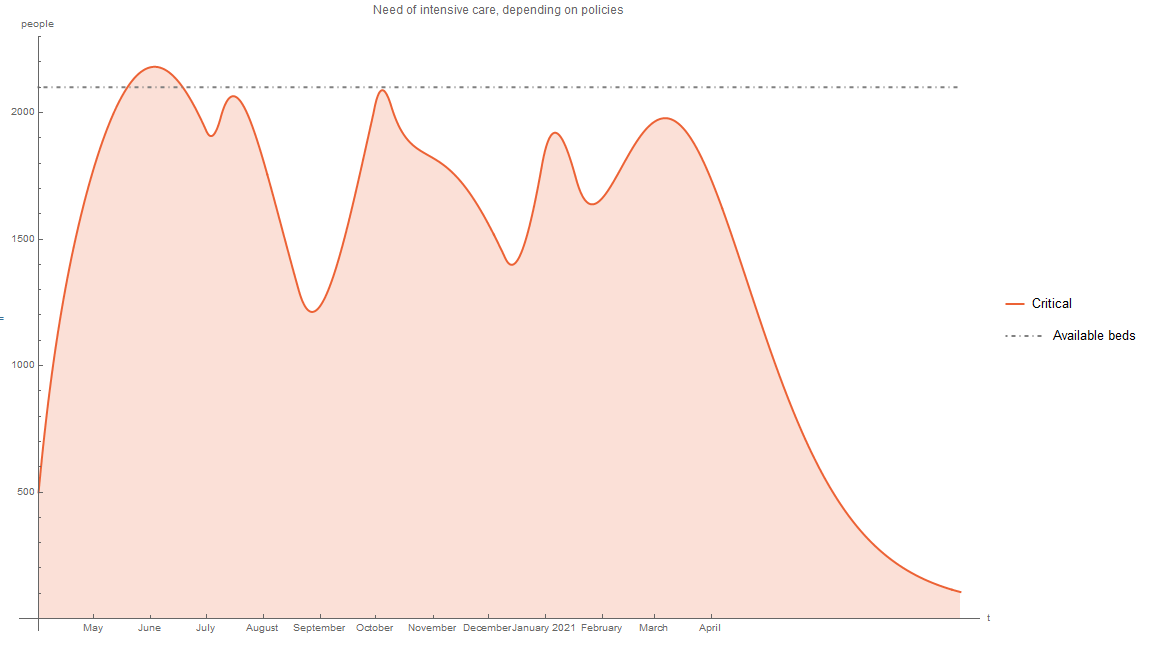
- Compromise
The first one, is shown in the default simulation. It shows that more than 40,000 people will need intensive care at the end of April if we follow this tactic. With a limit of 2,100 beds this is a disaster.
Now let us enable improved hygiene,isolation of sick, social distancing, lockdown, and close border for a quarter and see what happens. It looks great to begin with, but as soon as the policies are lifted we have a problem that is almost just as big as in the first case.
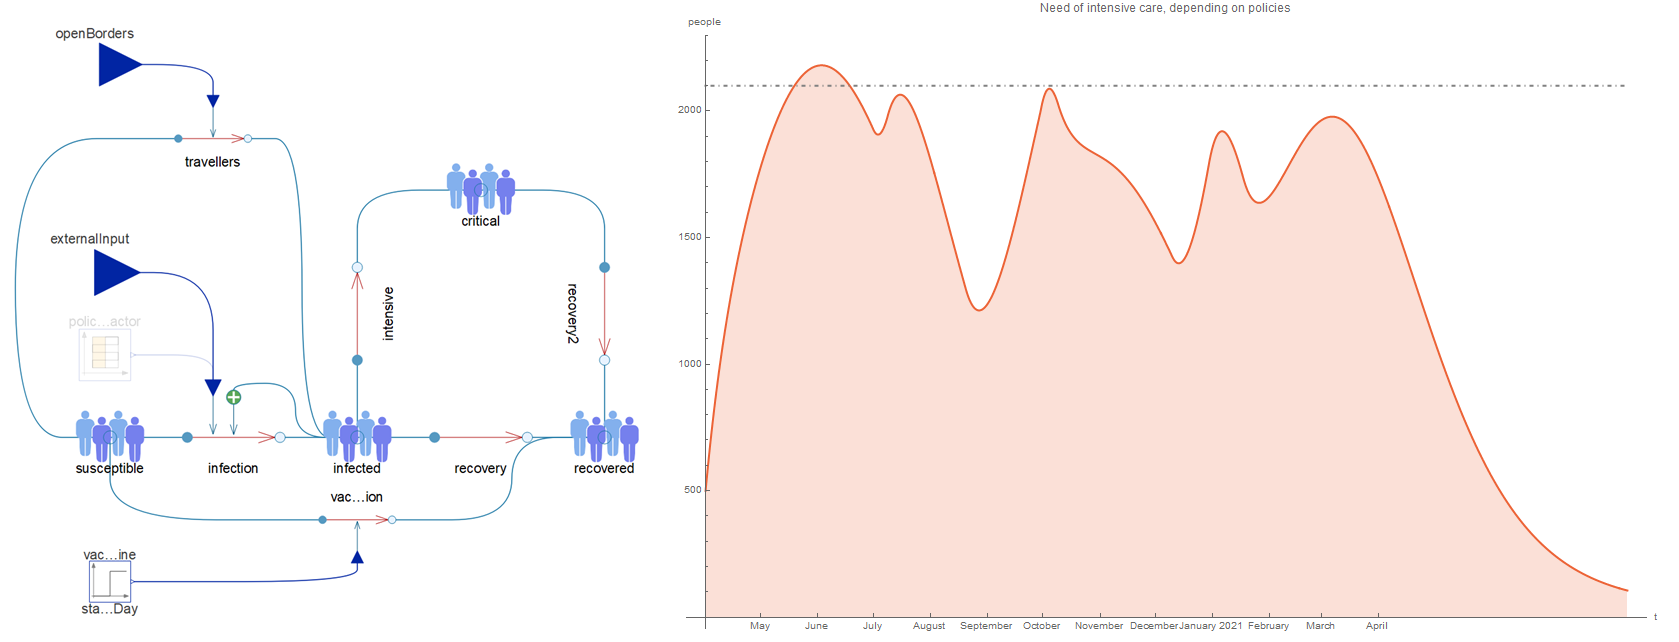
Finally, let us try to be a bit more clever. Turning the first three policies on and off over time, and then finally turning all off I got something that looks a lot more promising. In this simulation I am turning of the last policy beginning of February 2021. I am assuming that no vaccine will be available during this time and that there are no seasonal effect. Of course turning policies on and off is probably not the easiest thing to achieve in reality, but it is possible, at least as long as full quarantines are not needed.
Alternative setups
As mentioned, the model has been roughly tuned to Swedish circumstances. In doing so I have assumed that Sweden has an R0 value of 2.65, i.e. exactly the mean value. In reality I would believe that we have a lower value (a pure guess would be 2). Changing this assumption will change other values as follows:
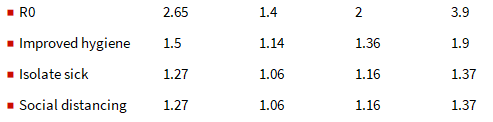
I recommend you to test these scenarios by yourself. Note that on April 7, the estimated range of R0 of COVID-19 went up to 3.8 [Dash] 8.9 on Wikipedia. How does this affect the model?
Find your best policy, or insight, and let send us an email to virtuallabs@wolfram.com with your strategy or suggestions for improvements.
I have attached two notebooks to this post. the first is the interactive version of this post and the second contains more details on the model, assumptions, and code. Remember that you will need the pre release) of the HighSchoolBiology Virtual Lab 1.1 (or wait until it is available)
 Attachments:


