Hello! I need some help with printing a function consisting of 3 variables. I want to plot it in the range R3 and my function is z>= Sqrt(x^2+y^2). I have tried to use ContourPlot but it just keeps failing. I do not have any limits for the variables but since ContourPlot uses it I have made up some limits but it still doesn't work. Please help! // Matilda
I am not sure exactly what you are trying to visualize. Maybe this?
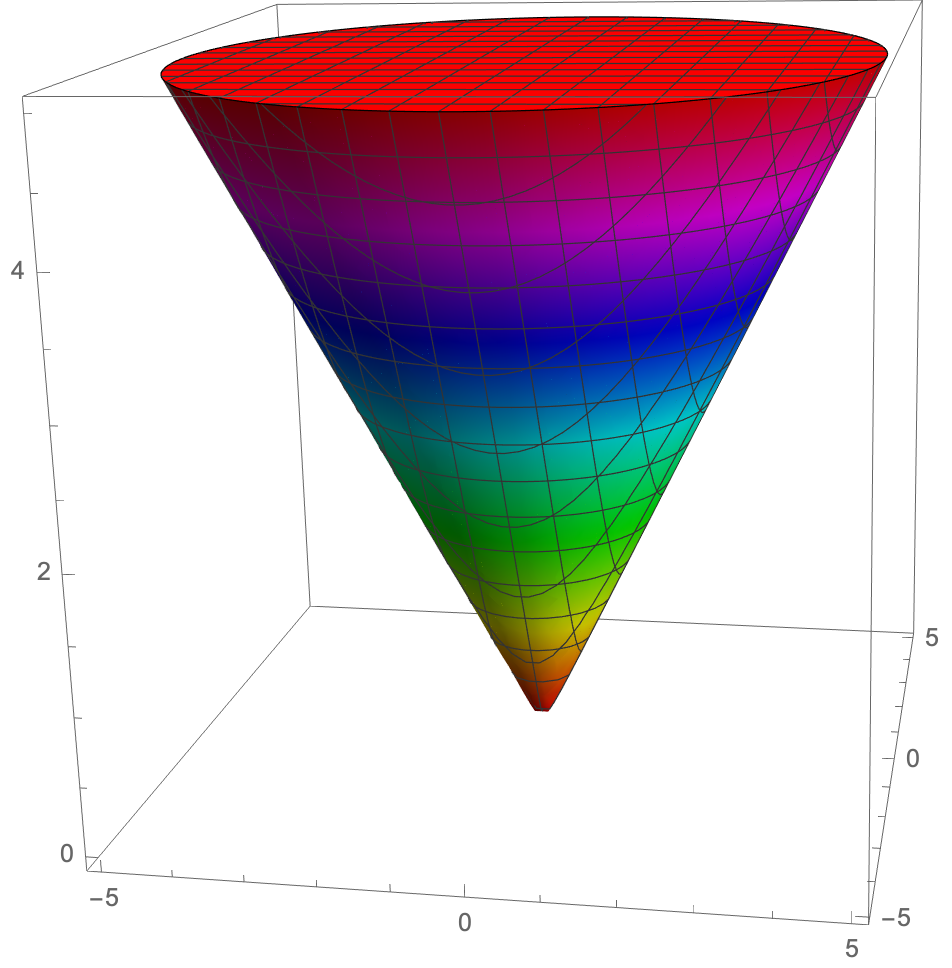
RegionPlot3D[z >= Sqrt[x^2 + y^2],
 {x, -5, 5}, {y, -5, 5}, {z, 0, 5},
 PlotPoints -> 50,
 ColorFunction -> Hue]
Thank you so so so so much! I think that's it! I am very new to Mathematica and all your help was truly gold! Thank you!!
Hi Matilda,
Is this what you are looking for?
z[x_, y_] := Sqrt[x^2 + y^2];
ContourPlot[z[x, y], {x, -5, 5}, {y, -5, 5}]
Wow thank you so much!!!
Do you think I should use ContourPlot3D instead since it's in range R3? Also, how would I make it ">=" instead of "="? It doesn't seem to work when I replace it just like that.