Message Boards Message Boards

0
|
6206 Views
|
3 Replies
|
7 Total Likes
View groups...
Share
Share this post:

Create a HeavisidePi Plot

Posted 4 years ago

How could i change This Plot This Plot

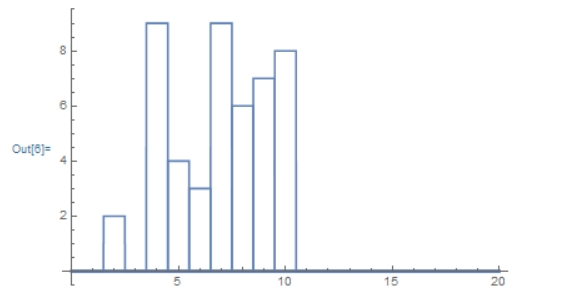
to something like this plot  this plot

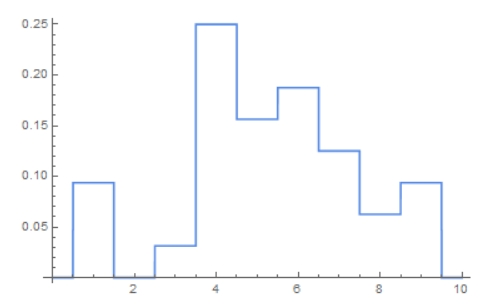
Each two plots are concatenation of HeavisidePi

The code for the first plot is :

listID1={2,0,9,4,3,9,6,7,8};
tCje[l_]:=Table[l[[n]]*HeavisidePi[x-(n+1)],{n,1,9}];
Plot[tCje[listID1],{x,0,20},Exclusions->None]
POSTED BY: omar awaisha
3 Replies

If it is just about the plot, you can try:

ListStepPlot[listID1, Center]

EDIT:

The above is "sub optimal", better is:

ListStepPlot[ArrayPad[listID1, 1], Center]
POSTED BY: Henrik Schachner
Posted 4 years ago

Do you mean style-wise or as a probability distribution or both or something else?

POSTED BY: Renay Oshop

Could change Table to Sum.

POSTED BY: Daniel Lichtblau
Reply to this discussion
Community posts can be styled and formatted using the Markdown syntax.
Reply Preview
Attachments
Remove
or Discard

Group Abstract Group Abstract