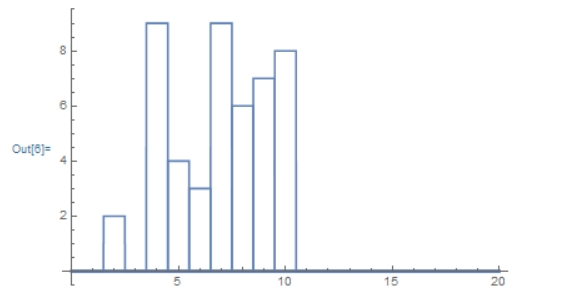
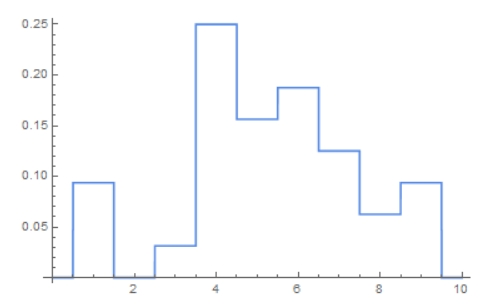
How could i change This Plot 
to something like this plot 
Each two plots are concatenation of HeavisidePi
The code for the first plot is :
listID1={2,0,9,4,3,9,6,7,8};
tCje[l_]:=Table[l[[n]]*HeavisidePi[x-(n+1)],{n,1,9}];
Plot[tCje[listID1],{x,0,20},Exclusions->None]