Message Boards Message Boards

1
|
5627 Views
|
8 Replies
|
9 Total Likes
View groups...
Share
Share this post:

Integration by counting points

Posted 11 years ago
Hi Im trying to obtain the area of the function f(x)=x^3 from 1 to 3, but by aproximation with random points in a rectangle area of [1,3]X[3,27] but I can´t count the points that are inside my function only is this I need the total points that are inside my function from 1 to 3.
In mathematica I put this:
 fn[x_] := If[1 < x < 3, x^3, 0]
 
 f3 = Plot[fn[x], {x, 0, 5}, Filling -> Axis, AxesOrigin -> {0, 0},
 
    PlotRange -> {0, 50}];
 
 f4 = Show[f3, Plot[x^3, {x, 0, 10}], AxesLabel -> {"x", "y"},
 
   PlotLabel -> "y=x^3"]
nlist = 1000;

For[i = 1, i <= nlist, i++, z[i] = RandomReal[{1, 3}];]


For[i = 1, i <= nlist, i++, w[i] = RandomReal[{0, 27}];]
u = Table[{z[i], w[i]}, {i, 1, nlist}];

ranpa = ListPlot[u, AxesOrigin -> {0, 0}, PlotRange -> {0, 50}]
Show[ranpa, f4]
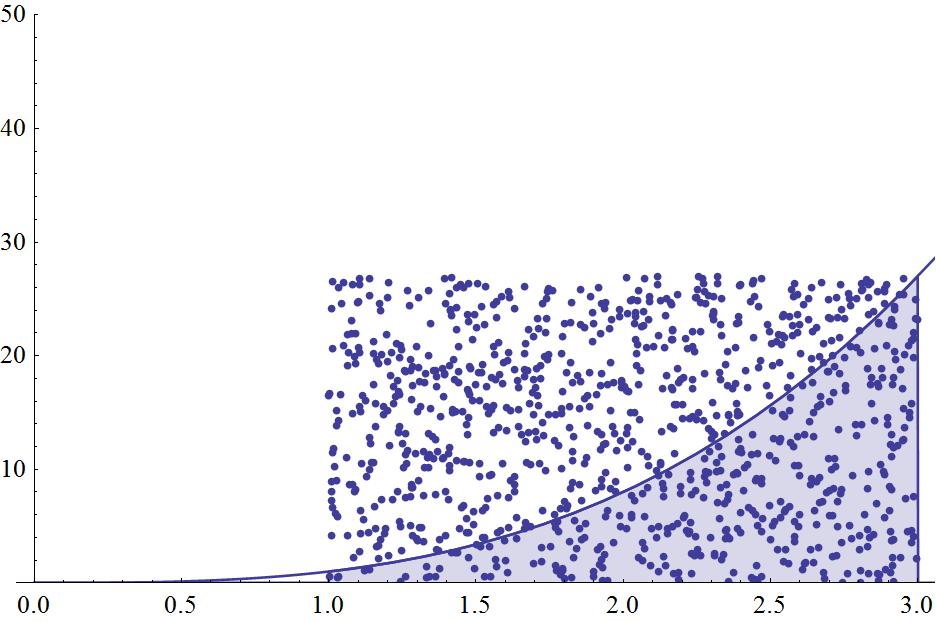


Someone told that is using If and Do, but a can´t find out how.

Thanks!
POSTED BY: Charls Mejía
8 Replies
A different "integration by points" method is
(3-1) Mean[RandomReal[{1, 3}, 100000]^3]

which is sort of a mean value theorem approach.
POSTED BY: Todd Rowland
Here's another way to count the number of points under the graph, mapping the unit square to the region [1,3]x[3,27] and using UnitStep to mark the points on either side of the graph with 0 or 1. 
(n = 1000000;
  pts = RandomReal[{0, 1}, {2, n}];
  pts = {2 pts[[1]] + 1, 27 pts[[2]]};
  marks = UnitStep[pts[[1]]^3 - pts[[2]]];
  Total @ marks (2. * 27/n)) // AbsoluteTiming

(* Out[1]= {0.107273, 20.0029} *)
____
g = Graphics[{PointSize[Tiny],
      Point[Pick[Transpose@pts, marks, 1]]},
     Frame -> True, AspectRatio -> 0.6]
POSTED BY: Michael Rogers
Just using Boole
In[10]:= With[{np = 100000, a = 1, b = 3, c = 0, d = 27},
  Plus @@ (Boole[#[[2]] < #[[1]]^3]& /@ RandomVariate[UniformDistribution[{{a, b}, {c, d}}], np]) N[(b - a) (d - c)/np]
] // AbsoluteTiming

Out[10]= {0.048003, 19.9433}
POSTED BY: Udo Krause
It's the same approach really, since the two constructions for u are equivalent.
POSTED BY: Ilian Gachevski
Counting the points under the curve seems reasonable:
 In[1]:= With[{np = 100000, a = 1, b = 3, c = 0, d = 27},
  u = RandomVariate[UniformDistribution[{{a, b}, {c, d}}], np];
  N[(b - a) (d - c) Count[u, {x_, y_} /; y < x^3] / np]]
 
 Out[1]= 20.0372
 
 In[2]:= NIntegrate[x^3, {x, 1, 3}]
 
 Out[2]= 20.
POSTED BY: Ilian Gachevski
Posted 11 years ago
Thanks!, that´s nice model or another way to do it, the problem is that I need with the model given in my request, so i tried putting only your Count in my model  and failed
POSTED BY: Charls Mejía
Posted 11 years ago
Hint: By hand draw your 3 x 27 graph.
Imagine throwing darts and you are good enough that they always end up somewhere inside the 3 x 27.
Maybe there are a couple of different categories where the darts could end up.
Maybe you could think of a way to tell which category a dart fell in.
Maybe you could count something.
Maybe you could do this lots of time.
There really actually is a point to doing this by hand, if necessary.
Think, think, think.
Maybe you could even do this by hand a few times until...
Ah... the point of all this...
POSTED BY: Bill Simpson
Posted 11 years ago
Ok a thought that my area is already delimited by my table "u", and just have to condition for counting under my function, so I decided tu put:
If[0<u<x^3,Count[??]]
What am I going to count? points? 
I know that are 1000 points, and imagine that i want to count all, How can I count them independently of the function.
POSTED BY: Charls Mejía
Reply to this discussion
Community posts can be styled and formatted using the Markdown syntax.
Reply Preview
Attachments
Remove
or Discard

Group Abstract Group Abstract