Hi Ken,
This is a very typical volume integration problem. The math issue is not the problem of finding the integral -- the integrand is 1. The problems arise because the boundary conditions force you to break the problem up into numerous subintegrals, generaly where the upper integration limits are functions of the lower integration variables. With this tank problem, the number and nature of the subintegrals depends on how full the tank is and how it's tilted. Very clumsy.
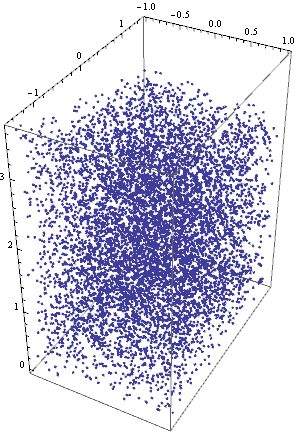
One alternative numerical strategy is overfilling the volume with random points and testing them to determine how many are in the tank, and of those how many are under the top of the liquid level. An example might be a 2D integration of a complex shape. It may be diffcult to segment a symbolic integral, but if you can define a simpler test to see if a point is inside the boundary, and you overfill the region with a known number of random points in a known area, then you know the area per point. You can just count the random points inside the region to estimate its area. The more points the better.
In the code below, I assume a recatangular tank. To make matters simple, I leave the tank level and tilt and displace the liquid level. The liquid level is defined by having a fixed height above a measurement point on the tank base, with a level plane defined by its normal vector. (The usual point-vector definition for a plane.) It's the same problem. Then I fill the entire tank with random points. (If the tank was more complex, it would be easier to fill a larger region and select out the points in the tank.) Then the points are tested to select only those which are under the plane defining the liquid level. Counting the points gives the fill of the tank.
The code below can be executed if loaded into Mathematica and separated into individual cells.
Best,
David
(* Define tank volume lxwxh and determine if {x,y,z} is in the tank *)
inTank[{x_, y_, z_}, {l_, w_, h_}] := -l/2 < x < l/2 && -w/2 < y <
w/2 && 0 < z < h
(* define z[{x_,y_},{xm_,ym_,zm_},{xt_,yt_,zt_}] for {x,y} on the \
tank floor and liquid measured to have depth zm above the point \
{xm_,ym} on the tank floor, and with the liquid surface a plane \
passing through measurement point {xm,ym,zm} and normal to vector \
{xt_,yt_,zt} which defines the tilt of the liquid surface *)
z[{x_, y_}, {xm_, ym_, zm_}, {xt_, yt_, zt_}] := Module[
{nx, ny, nz, zz},
{nx, ny, nz} = Normalize[{xt, yt, zt}];
zz /. Solve[{nx, ny, nz}.({x, y, zz} - {xm, ym, zm}) == 0, zz][[1]]
]
(* Fill the tank with random points *)
points[{l_, w_, h_}, n_] := Table[
{RandomReal[{-l/2, l/2}], RandomReal[{-w/2, w/2}],
RandomReal[{0, h}]}, {n}]
(* make a set of sampling points that fills the tank. For a moe \
complex tank shape it make be more convenient to fill a space that \
enclosed the tank, and then select points within the tank. *)
samplingPoints = points[{2, 3, 4}, 10000];
(* This just plots them. *)ListPointPlot3D[samplingPoints,
BoxRatios -> Automatic]
(* This selects only those points beneath the plane defining the \
liquid level *)
filledPoints =
Select[samplingPoints, #[[3]] <
z[#[[{1, 2}]], {0.5, 1, 3}, {.1, .2, 1}] &]
(* Plot those *)
filledPlot = ListPointPlot3D[filledPoints, BoxRatios -> Automatic]
(* This is the fraction of sample points in the tank which are under \
the liquid level *)
filledFraction = Length[filledPoints]/Length[samplingPoints] // N
Export["filled.png", filledPlot]
Here is a plot of the points representing the partially filled tilted tank:
