Message Boards Message Boards

2
|
10550 Views
|
2 Replies
|
4 Total Likes
View groups...
Share
Share this post:

Fitting a three-Gaussian model on data

Posted 11 years ago
Hi!
I want  to fit a three-Gaussian model on a given data (download-link: http://sharesend.com/6yhykztt).
I've tried different inital Number to get the fit to converge. Either the left peak doesn't converge or the peak in the middle doesn't converge.

Would be grateful if somebody has some hint or solution for this problem!

Best regards,

Tohu
data = Import["$path/data.txt", "Table"];
Block[{$DisplayFunction = Identity},
  dataPlot =
    ListPlot[data, PlotStyle -> {AbsolutePointSize[4], Hue[.7]},
     PlotRange -> {{0, 400}, {0, 65000}}];
  ];
Show[dataPlot]
 model = (amp1 E^(-((-mu1 + x)^2/(2 sigma1^2)))) + (amp2 E^(-((-mu2 +
              x)^2/(2 sigma2^2)))) + (amp3 E^(-((-mu3 +
              x)^2/(2 sigma3^2))));
 
 
 vars = {{amp1, 63000}, {mu1, 100}, {sigma1, 8}, {amp2, 6000}, {mu2,
     210}, {sigma2}, {amp3, 40000}, {mu3, 310}, {sigma3}};
 cons = And @@ Thread[{amp1, sigma1, amp2, sigma2, amp3, sigma3} > 0];
 fit = NonlinearModelFit[data, {model, cons}, vars, x,
  MaxIterations -> 100]


Show[Plot[fit[x], {x, 0, 500}, PlotRange -> All,
  PlotStyle -> {Thick, Red}],
ListPlot[data, PlotStyle -> Opacity[0.5]]]
fit["ParameterTable"]
POSTED BY: Tohu arn
2 Replies
Hi,

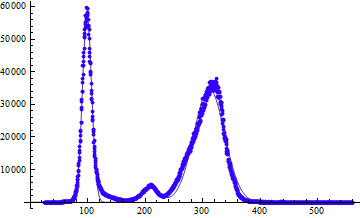
Is it some kind of photon distribution? If you split your problem into parts result will look slightly better.
 model1 = (amp1 E^(-((-mu1 + x)^2/(2 sigma1^2))));
 
 model2 = (amp2 E^(-((-mu2 + x)^2/(2 sigma2^2))));
 model3 = (amp3 E^(-((-mu3 + x)^2/(2 sigma3^2))));
 
 vars1 = {{amp1, 63000}, {mu1, 100}, {sigma1}};
 vars2 = {{amp2, 6000}, {mu2, 210}, {sigma2}};
 vars3 = {{amp3, 40000}, {mu3, 310}, {sigma3}};
 
fit1 = NonlinearModelFit[data1, {model1, amp1 > 0 && sigma1 > 0}, vars1, x, MaxIterations -> 100];
fit2 = NonlinearModelFit[data2, {model2, amp2 > 0 && sigma2 > 0}, vars2, x, MaxIterations -> 100];
fit3 = NonlinearModelFit[data3, {model3, amp3 > 0 && sigma3 > 0}, vars3, x, MaxIterations -> 100];

Show[
Plot[{fit1[x] + fit2[x] + fit3[x]}, {x, 0, 500}, PlotRange -> All],
ListPlot[data, PlotStyle -> {AbsolutePointSize[4], Hue[.7]},
  PlotRange -> {{0, 400}, {0, 65000}}]
]


Sorry, I forgot to add definitions for data1,data2 and data3,
each of them in fact something like Take[data,{n,m}] where n&m are chosen so that data looks like gaussian in that range.
I've already removed exact ranges, but I still have them loaded into memory, so here are the files
http://sharesend.com/h35pjd31 - d3.txt
http://sharesend.com/0faxgkcx - d2.txt
http://sharesend.com/att5y5vc - d1.txt

I.M.
POSTED BY: Ivan Morozov
Hello I´m having a similar problem , i want to fit a Gaussian for this set of data (which is normalized) but i dont have notting 
 data = Import["$/normref.txt",
 
    "Table"];
 
 dataPlot = ListPlot[data, PlotRange -> All];
 
 Show[dataPlot]


model1 = ( E^(-((-a + x)^2/(2 b^2))));

fit1 = NonlinearModelFit[data, {model1, b > 0}, {a, b}, x,

  MaxIterations -> 100]

Show[Plot[fit1[x], {x, 0, 1000}, PlotRange -> All,

  PlotStyle -> {Orange}],

ListPlot[data, PlotRange -> {{0, 400}, {0, 1.2}}]]
  

I add the code and the data file 

I hope you could helpme 

Regards
Attachments:
Reply to this discussion
Community posts can be styled and formatted using the Markdown syntax.
Reply Preview
Attachments
Remove
or Discard

Group Abstract Group Abstract