Message Boards Message Boards

Add distribution plots to residual plot

Posted 4 years ago

Hi,

How do I add the distributions for the train and test data set like the attached figure in my notebook?

enter image description here

Attachments:
POSTED BY: Alex Teymouri
5 Replies
Posted 4 years ago

Epilog takes a list of Graphics primitives and directives. e.g.

Epilog -> {Blue, Thick, Line[{{0, 0}, {80, 80}}]}
POSTED BY: Rohit Namjoshi
Posted 4 years ago

A perfect solution. Thank you, Rohit.

I tried to add Y=X to the plots and change the color of distribution plots.Please see the enclosed notebook.Where did I go wrong?

GraphicsRow[
 Table[DensityHistogram[data, {{2.5}, {2}}, 
   ColorFunction -> "DarkRainbow", 
   Method -> {"DistributionAxes" -> p}, 
   Epilog -> {data, Line[{{0, 0}, {80, 80}}]}, ImageSize -> 500, 
   BaseStyle -> {FontFamily -> "Helvetica"}, LabelStyle -> Bold, 
   ChartElementFunction -> "Bubble"], {p, {"SmoothHistogram", 
    "BoxWhisker"}}]]
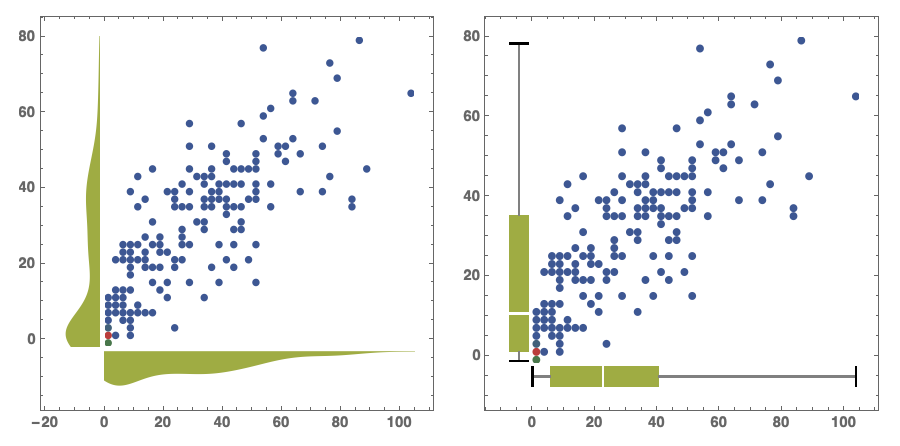
POSTED BY: Alex Teymouri
Posted 4 years ago

Hi Alex,

Looks like SmoothDensityHistogram does not support Method -> {"DistributionAxes" -> "SmoothHistogram"}. You have to use "Histogram", or generate a SmoothHistogram separately and add it to the plot as shown in the first link I mentioned.

I want the points to be displayed like a circle when I use DensityHistogram.

Add ChartElementFunction -> "Bubble". The bubbles are oval because the range of x and y values is different. You can work around that by providing a binning specification that is in the ratio of the range of x and y which is 10/8. e.g. Using {{2.5}, {2}}

GraphicsRow[Table[DensityHistogram[data, {{2.5}, {2}},
   ColorFunction -> "DarkRainbow",
   Method -> {"DistributionAxes" -> p},
   ImageSize -> 500,
   BaseStyle -> {FontFamily -> "Helvetica"},
   LabelStyle -> Bold,
   ChartElementFunction -> "Bubble"],
  {p, {"SmoothHistogram", "BoxWhisker"}}]]

enter image description here

POSTED BY: Rohit Namjoshi
Posted 4 years ago

Hi Rohit,

Thanks for your help.

I didn't get an expected output for SmoothDensityHistogram ?

And

I want the points to be displayed like a circle when I use DensityHistogram.

I really appreciate your help.

Alex

Attachments:
POSTED BY: Alex Teymouri
Posted 4 years ago

Some ideas here and here.

POSTED BY: Rohit Namjoshi
Reply to this discussion
Community posts can be styled and formatted using the Markdown syntax.
Reply Preview
Attachments
Remove
or Discard

Group Abstract Group Abstract