Group Abstract Group Abstract

Message Boards Message Boards

0
|
9.7K Views
|
4 Replies
|
0 Total Likes
View groups...
Share
Share this post:

3D Plot of Points

Measured a series of land elevations along polar coordinates and entered into a spreadsheet using a transit. Converted coordinates to Cartesian. File attached. Trying to plot the 3D surface. Most plot utilities seem to plot functions rather than coordinate sets. Can someone help?

POSTED BY: John Lawton
4 Replies

Oh. I guess it's thanks David for the plot w/interpolation.

POSTED BY: John Lawton
Posted 6 years ago
POSTED BY: Bill Nelson
Posted 6 years ago

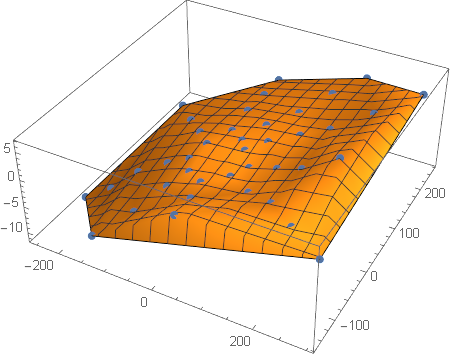
You can import the Excel sheet and plot the points or a surface, or both together:

data = Rest@
   Import["F:\\Users\\David\\Documents\\Mathematica Files\\Wolfram \
Forum\\Lawton\\Turnaround Elevation.xlsx"][[1]];
Show[ListPointPlot3D[data], ListPlot3D[data]]

enter image description here

I attach a notebook.

Kind regards,

David

Attachments:
POSTED BY: David Keith
Reply to this discussion
Community posts can be styled and formatted using the Markdown syntax.
Reply Preview
Attachments
Remove
or Discard