Message Boards Message Boards

0
|
2901 Views
|
4 Replies
|
0 Total Likes
View groups...
Share
Share this post:

Need help to draw a differential equation

Posted 4 years ago

Hi, I'm novice in Wolfram Mathematica Language and I have to draw two differential equations. They represent the Lokta Model. Here the equations :

x˙=x(1−y)

y˙=y(−λ+x)

And I have to draw it like in this page : https://experiences.math.cnrs.fr/Le-modele-proie-predateur-de-Lotka.html

I really hope you can help me because it's very difficult for a novice in Wolfram! Thank you for your help. Regards.

POSTED BY: Benjamin Coron
4 Replies
Posted 4 years ago

Thank you so much Henrik Schachner and Gianluca Gorni for your help. I really have to learn this language because it seems so good to us it when you know his capacities.

Have a good day.

Thanks again!

POSTED BY: Benjamin Coron

@Gianluca Gorni : Nice - simple, but very intuitive!

I guess for the full solution one needs ParametricNDSolve and friends:

ClearAll["Global`*"]
(* define the Lotka model: *)
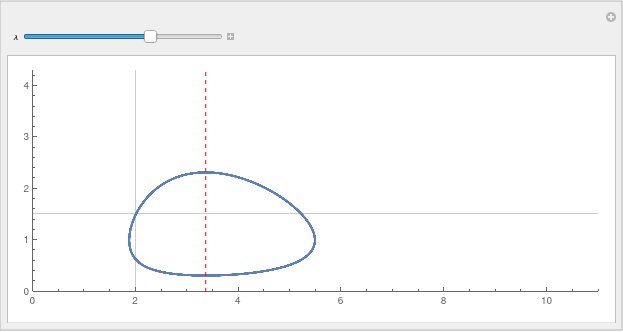
x0 = 2; y0 = 1.5;
tRange = {t, 0, 30};
deq = {x'[t] == x[t] (1 - y[t]), y'[t] == y[t] (-\[Lambda] + x[t]), x[0] == x0, y[0] == y0};
(* solve it: *)
lotka = ParametricNDSolveValue[deq, {x[t], y[t]}, tRange, {\[Lambda]}];
(* show the solution: *)
Manipulate[ParametricPlot[lotka[\[Lambda]], Evaluate@tRange, PlotRange -> {{0, 11}, {0, 4.3}}, PerformanceGoal -> "Quality", 
  ImageSize -> Large, GridLines -> {{x0}, {y0}}, Epilog -> {Dashed, Red, 
    InfiniteLine[{{\[Lambda], 0}, {\[Lambda], 1}}]}], {\[Lambda], .3, 5}]
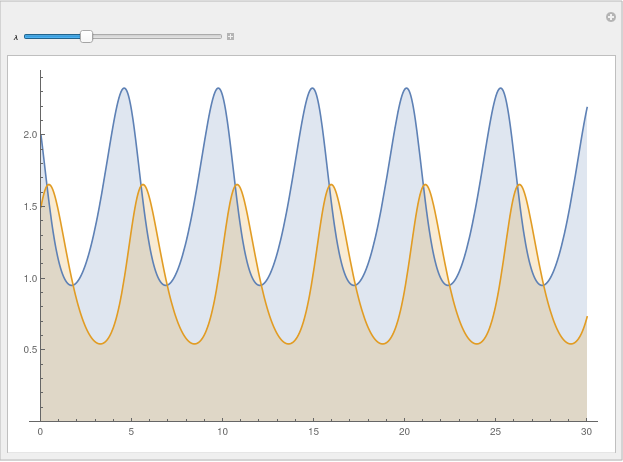
enter image description here

Manipulate[
 Plot[Evaluate@lotka[\[Lambda]], tRange, Filling -> Bottom, 
  PlotRange -> {0, Automatic}, ImageSize -> Large], {\[Lambda], 0, 5}]

enter image description here

POSTED BY: Henrik Schachner

That is not quite a project for a novice. However, here is a way:

Manipulate[
 StreamPlot[{x (1 - y), y (-\[Lambda] + x)},
  {x, 0, 2}, {y, 0, 2}],
 {{\[Lambda], 1}, 0, 2}]
POSTED BY: Gianluca Gorni
Posted 4 years ago

Yeah I know but I have to do it. Thank you i just try your code! Now the most important for my document it's the diagram with (x+y) in function of time. The graph under on the website cnrs.

Have you an idea or something to help me on that? Sorry I don't want to take your time if you can't it's okay ;)

POSTED BY: Benjamin Coron
Reply to this discussion
Community posts can be styled and formatted using the Markdown syntax.
Reply Preview
Attachments
Remove
or Discard

Group Abstract Group Abstract