Hello!
I have been at this for a week and I don't know where else to ask. I am trying to solve for chi^2 from a distribution fit using Mathematica. I have the following data:
{812,827,782,841,839,803,800,818,790,838,783,768,799,854,805,832,786,838,802,805,825,784,797,808,846,809,814,857,884,855,800,855,818,865,801,823,812,861,807,830,813,827,819,796,870,825,827,872,770,849,813,828,839,804,805,833,833,871,856,819,787,819,852,786,864,841,799,804,812,831,830,810,863,856,794,808,794,838,748,757,866,778,823,818,830,794,831,838,853,836,821,836,797,863,811,867,803,821,864,819}
It is expected that this data will follow Poisson and Normal Distributions. I can get these fit parameters by using FindDistributionParameters[]. I can also plot these distribution equations against the data to show that it's a good fit visually speaking (although the units may be incorrect):
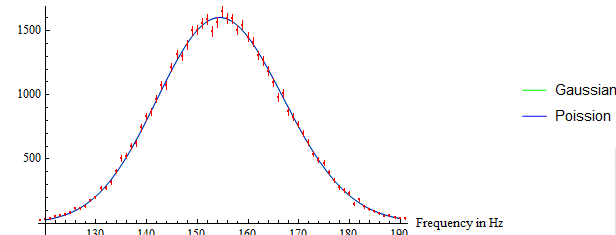
What I can't figure out though is how to obtain data showing why this is a good fit, specifically the value chi^2 (which is required for what I am doing.) I tried to calculate this manually, but my values are way off what my peers are obtaining using different programs. The equation I am attempting to solve manually is this oneL 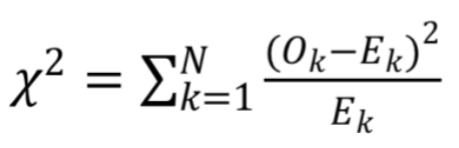
Where Ok is the measured point and Ek is the point as expected by the fit. I don't think this is working because I think this equation requires actual values, while Mathematica's Poisson and Normal distributions are probability based. Here's the code I have been using:
FindDistributionParameters[CS2S1r, NormalDistribution[Mu, Sig]]
FindDistributionParameters[CS2S1r, PoissonDistribution[Mu]]
mu = 822.04;
sig = 27.6452;
binCount= 100;
Chi2g = 0;
Chi2p = 0;
h[x_] = PDF[HistogramDistribution[CS2S2r, binCount], x]
f[x_] = PDF[NormalDistribution[mu, sig], x];
g[x_] = PDF[PoissonDistribution[mu], x];
For[i = 764;, i <= 892, i += 1, Chi2g += (h[i] - f[i])^2/f[i]];
For[i = 764;, i <= 892, i += 1, Chi2p += (h[i] - g[i])^2/g[i]];
Here, mu is the mean of the distribution and sig is the standard deviation. Both of these were determined by using FindDistributionParameters[]. binCount is a number I am going to tweak later, but I set it as high as I could so that each step is the same size as the steps in the data. CS2S2r is the name of my data itself, and 764 and 892 were chosen as the bounds because those are the greatest and smallest numbers found in the data itself.
Does anyone know how I might obtain this? Am I fitting the distributions in the correct way? Is there anything else I should do differently?
All help is appreciated, thank you!
Edit: It looks like FindDistribution[] does what I am looking for, but I am not sure if the ChiSquared that it reports is the actual ChiSquared value, or if it's the p-value that comes from a non displayed ChiSquared. I also don't know how to get this to work with error bars, any ideas?


