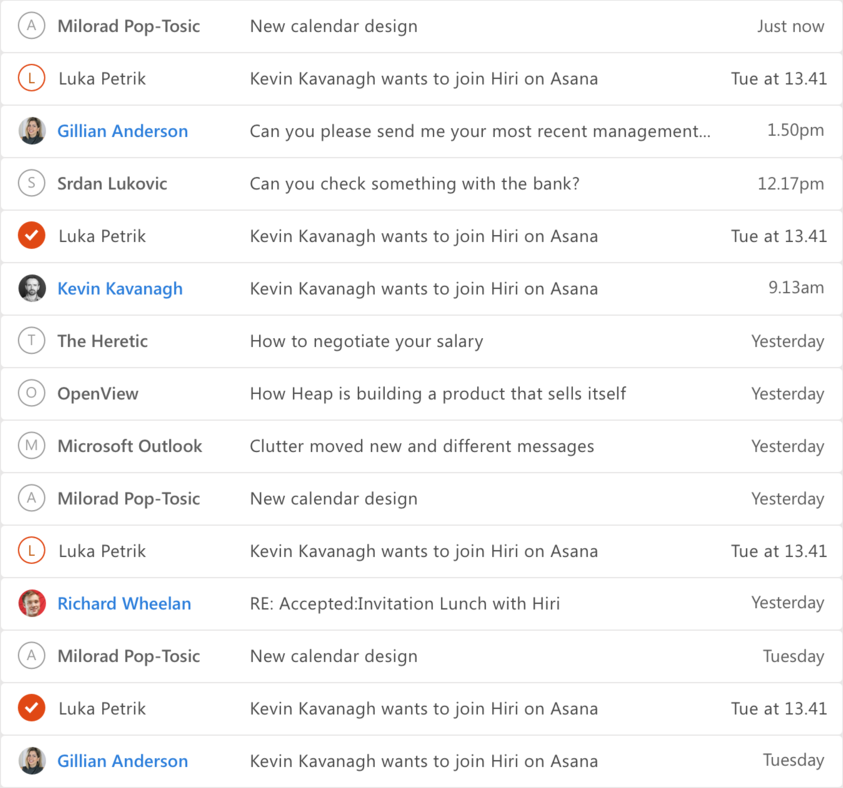
The interface for email conversation traversal most often takes the form of a linear column of timestamped message excerpts with nested replies inlined within the message body.

This is an excellent way to visualize the newest messages awaiting a response or action, but fails to illustrate the community structure and information flow within an inbox.
Meet InboxGraph
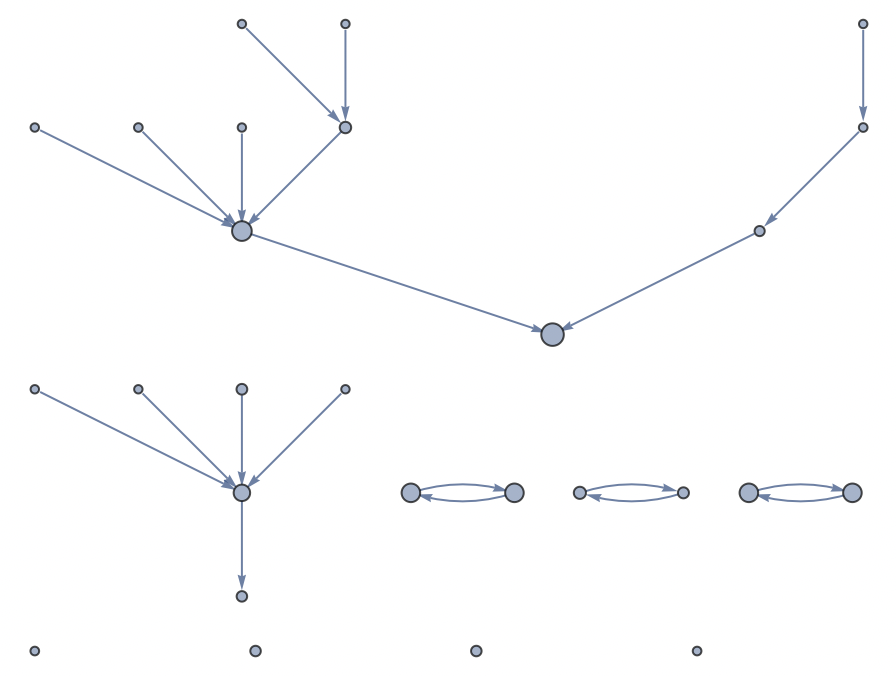
InboxGraph is a property graph representation for email, in which message collections are projected onto a higher-dimensional space using directed edge linking across threads.
RFC-822 message parsing is used to extract message trajectories between servers and network participants, forming a metadata-rich lattice of vertices and edges inside a directed graph.
Asymmetrical relationships between participants are used to calculate Address Rank measurements of information flow importance and to partition the graph into best-fitting communities, opening new channels for organizational optimization. Additional layers of natural language processing and data export to open formats permit further interactive exploration, querying, and discovery of deeper associations within the graph.
How it works

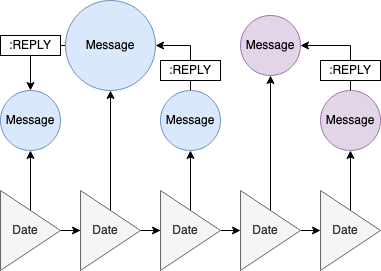
A linked DateObject time series creates a linear backbone structure for the graph, linking out to messages. Messages then link out to their respective replies using a unique Message Identifier.
(*BuildLinkedGraph creates a directed linear list of vertices with \
optional tooltips*)

Options[BuildLinkedGraph] = {"ShowTooltip" -> False};
BuildLinkedGraph[v_List, OptionsPattern[]] := (
  Graph[v, MapIndexed[v[[#2[[1]]]] -> #1 &, v[[2 ;;]]],
    VertexLabels -> {
        # -> If[OptionValue["ShowTooltip"], Placed[#, Tooltip], #]
        } & /@ v] // Flatten
  )

(*Build message thread edges.*)
eMsgs = Values[
   Map[#ReplyToMessageID -> #MessageID &,
    Select[mboxData, #ReplyToMessageID =!= None &&
       MemberQ[vMsgs, #ReplyToMessageID] &]]];

(*Connect message vertices to relevant time series anchor vertices.*)
eMsgDates =
  Flatten[{DateObject[mboxData[#][fields[[2]]], "Day"] -> #} & /@
    vMsgs];
To highlight the importance of a message within the graph, a VertexSize parameter is generated from the vertex degree.
(*Calculate message importance by Vertex Degree*)

g = Graph[vMsgs, eMsgs];
sMsgs = KeyValueMap[# -> #2 &,
   AssociationThread[
    VertexList[g],
    (*Scale values using VertexSizeRange parm.*)

    Rescale[VertexDegree[gMsgs]]*
      (OptionValue["VertexSizeRange"][[2]] -
        OptionValue["VertexSizeRange"][[1]]) +
     OptionValue["VertexSizeRange"][[1]]
    ]
   ];
Communities are defined within the graph by a graph partitioning algorithm which finds the best-fitting subgroups by thread participation.
(*GetGraphPartitionGroups returns the best-fitting subgroup \
partitioning for a collection of overlapping groups.*)

GetGraphPartitionGroups[subgroups_List] :=
 Module[{uniqueItems, e, g, p},
  (*GetOccurLength returns the number of subgroups co-occurances.*)

  GetOccurLength[groups_, {i_, j_}] :=
   Count[ContainsAll[#, {i, j}] & /@ groups, True];

  uniqueItems = Flatten[subgroups] // DeleteDuplicates;

  (*Construct graph partitioning edges for subgroups using co-
  occurance counts.*)
  e = DeleteCases[
    If[
       Unequal @@ #,
       {UndirectedEdge @@ #, GetOccurLength[subgroups, #]},
       Nothing
       ] & /@ Subsets[uniqueItems, {2}],
    {_, 0}
    ];

  (*Construct graph using co-occurences as edge weights.*)

  g = Graph[e[[All, 1]], EdgeWeight -> e[[All, 2]],
    VertexLabels -> Automatic, EdgeLabels -> "EdgeWeight"];

  (*Add remaining isolated subgroups.*)

  g = VertexAdd[g, Complement[uniqueItems, VertexList[g]]];

  (*Partition by edge weight sum minimization.*)

  p = If[Length[#] > 1, FindGraphPartition[Subgraph[g, #]], {#}] & /@
    ConnectedComponents[g];
  Join @@ p
  ]
A perceptually uniform color space is applied in the coloring of the community partitions.
(*Perceptually-uniform palette generation with Lightness/Chroma/Hue \
selection.*)

communitySubgroupColors =
  Map[LCHColor[0.5, 1, #/Length[communitySubgroups]] &,
   Range[Length[communitySubgroups]]];
The destination volume between addresses is tallied to direct an information flow edge.
(*Tally the number of messages between unique participants.*)
msgTally = Select[
   Tally[Flatten[Map[Function[msg, {msg[[1]] -> #} & /@ msg[[2]]],
      msgDeliveries]]],
   #[[1]][[1]] != #[[1]][[2]] & (*Ignore self-
   directed messages.*)
   ];
msgTallyGroups =
  Normal[GroupBy[{#[[1]][[1]], #[[1]][[2]], #[[2]]} & /@ msgTally,
    First]];
Then, these edges are used to calculate the address importance within the network graph using a page rank centrality algorithm.
e = Flatten[{#[[1]] -> Sort[#[[2]], #1[[3]] > #2[[3]] &][[1, 2]]} & /@
    msgTallyGroups]; (*Edge by destination volume.*)
ePageRank = #[[
    1]] & /@ msgTally;(* All messaging edges.*)
s =
 AssociationThread[v,
   Rescale[PageRankCentrality[Graph[v, ePageRank], 0.85]]*.25 + .15] //
   Normal;

Putting it all together
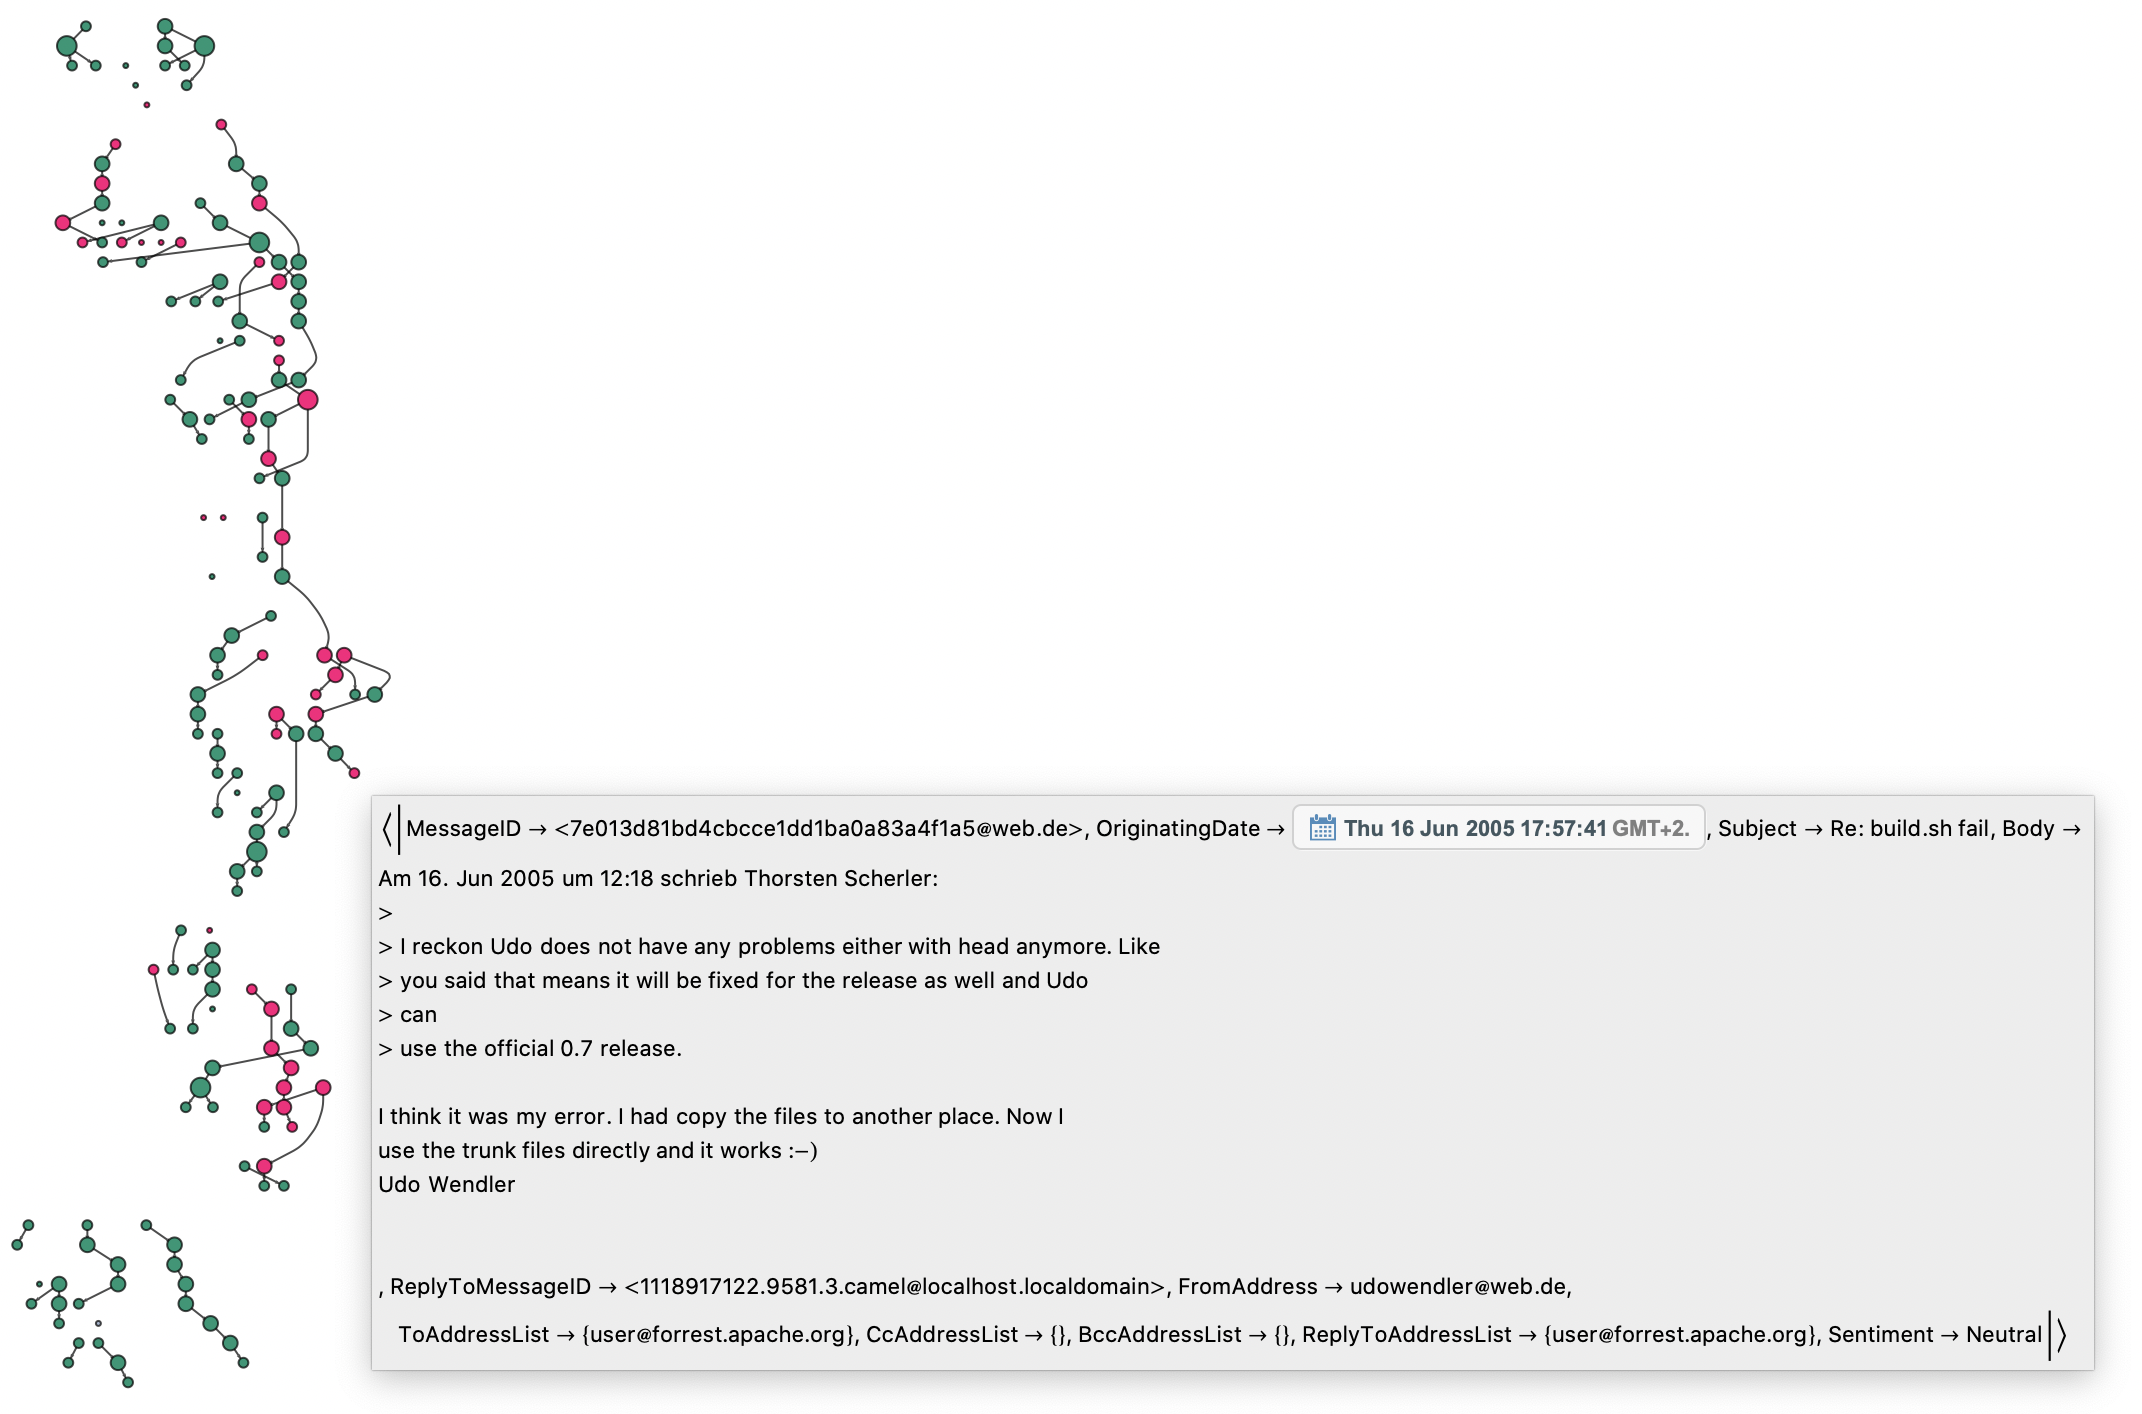
Leveraging the natural language processing capabilities of Wolfram Language, we can apply feature engineering to the message parsing block, adding in sentiment analysis. At a quick glance, we can now see the tree-like structure of our message threads, the connections between the individuals involved, and the details for the messages.

View Notebook