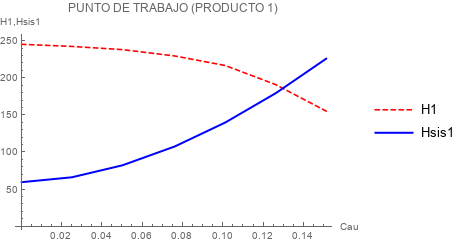
Cau={0.0001,.025,.05,.076,.101,.126,.151}

H1={245.714,242.857,238.571,230.,217.143,191.429,155.714}

Hsis1={60.0006,66.5794,82.682,108.123,140.356,179.839,226.309}

ListLinePlot[{Transpose[{Cau,H1}],Transpose[{Cau,Hsis1}]}]
Hi Luis,
Here is one way
fH1 = Interpolation[Transpose[{Cau, H1}]];
fHsis1 = Interpolation[Transpose[{Cau, Hsis1}]];

x = x /. FindRoot[fH1[x] == fHsis1[x], {x, 0.1}]
(* 0.129838 *)
y = fH1[x]
(* 186.525 *)

ListLinePlot[{Transpose[{Cau, H1}], Transpose[{Cau, Hsis1}]},
 Epilog -> {Red, PointSize[Large], Point[{x, y}]}]
Thank you very much Rohit
That is just what I need